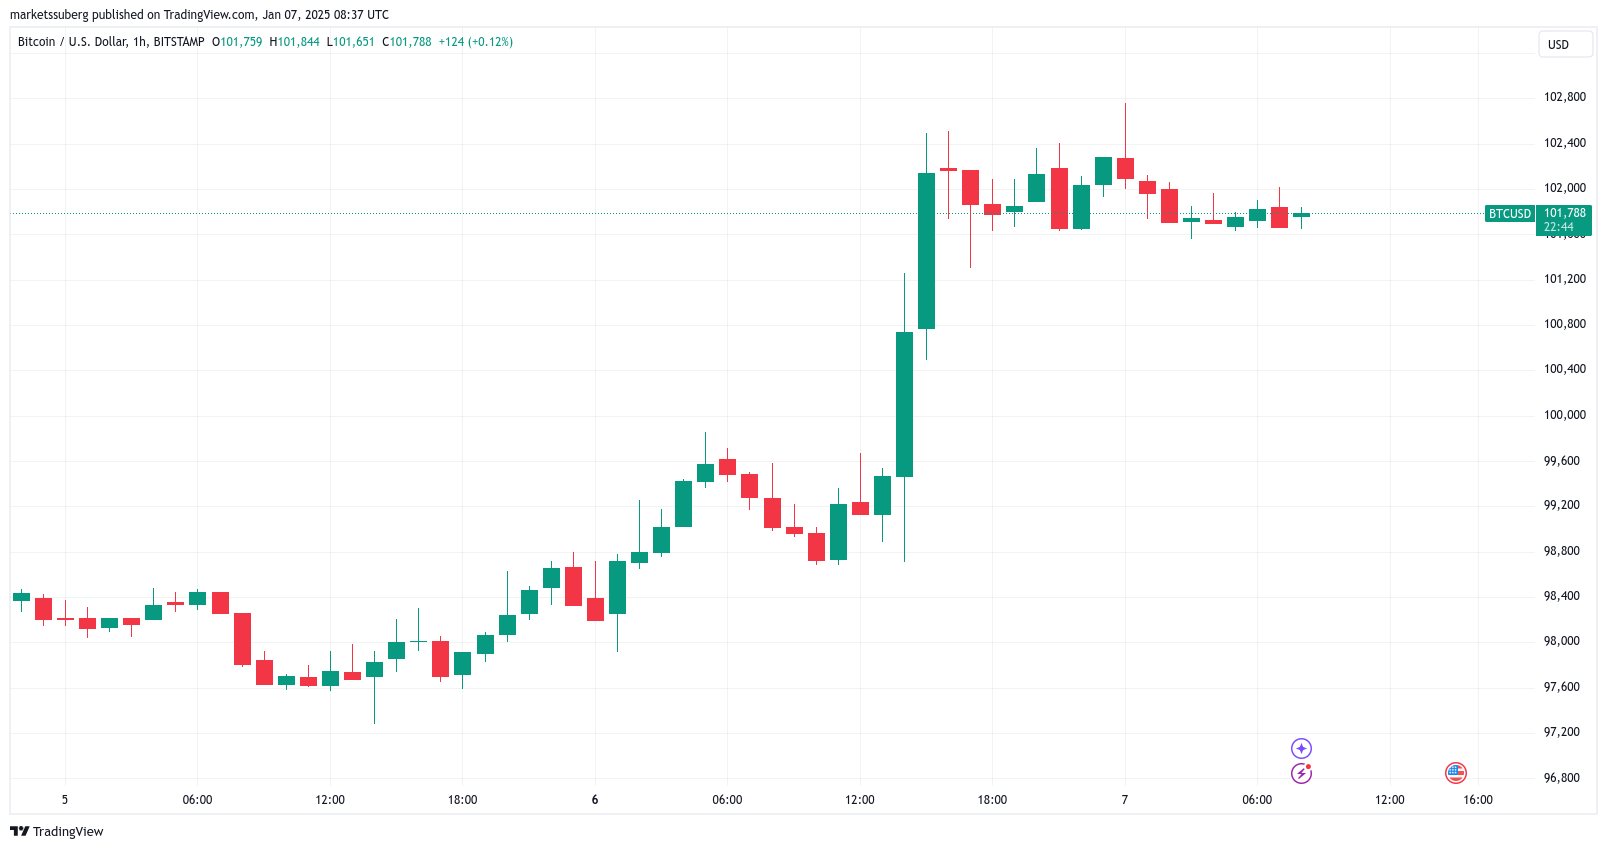
Bitcoin Analysts Set Sights on New Price Milestones as $100K Holds Firm
Bitcoin’s recent surge above $100,000 is fueling bullish predictions, with market analysts eyeing key technical levels that could shape its trajectory in the coming months.
Bitcoin’s Bullish Momentum Challenges Bearish Patterns
As Bitcoin ($BTC) maintains its position above the six-figure mark, bearish signals, such as the head and shoulders (H&S) pattern seen in December, are being called into question.
The H&S formation, typically signaling a trend reversal, is characterized by three peaks, with the central peak (the “head”) higher than the others (“shoulders”). For Bitcoin, the $108,000 all-time high marked the head. However, analysts suggest this bearish setup could fail, with BTC’s current push threatening to invalidate the pattern.
“A breach of the high of the possible right shoulder could negate the H&S formation, potentially setting a bullish target at $116,000,” noted trader and analyst Aksel Kibar on X.
Even if BTC retraces to $80,000, Kibar emphasizes this would likely be a pullback within the broader bullish breakout from last year’s $73,800 high.

Cup and Handle Formation Points to $140K Target
Another pattern energizing traders is the cup and handle, a bullish setup that appears to be gaining traction. After multiple tests of support near $90,000, Bitcoin now looks poised to resume its uptrend, targeting $140,000, according to trader Jelle.

The long-term implications of this formation remain optimistic. Analysts such as MartyParty have previously highlighted $125,000 as a plausible target, while Kibar has set his sights on $137,000 in the event of a breakout.

Fibonacci Levels Offer Clarity on BTC’s Potential
Zooming out further, Fibonacci retracement levels are providing valuable insights into Bitcoin’s potential price ceilings.
Keith Alan, co-founder of Material Indicators, highlighted how BTC’s recent surge encountered resistance at the 1.618 Fibonacci level, a zone of historical significance. Beyond $100,000, Fibonacci extensions suggest key resistance levels at $110,000, $122,500, and possibly as high as the 4.618 Fibonacci level in a cycle top scenario.

“The cycle top could land somewhere between $120K and technical resistance at higher Fibonacci levels,” Alan explained, pointing to historical patterns as a guide for the ongoing bull market.
Key Price Levels and Predictions
- $100,000: Current support level, critical for maintaining bullish sentiment.
- $116,000: Potential next target if the head and shoulders pattern is invalidated.
- $125,000–$140,000: Targets tied to the cup and handle formation.
- $450,000: Long-term Fibonacci extension milestone for the most ambitious predictions.
What’s Next for Bitcoin?
With Bitcoin consolidating above $100,000, the market is abuzz with optimism. Analysts agree that breaking through key resistance levels could propel BTC into uncharted territory, with targets ranging from $116,000 in the short term to $450,000 in the long term.

While bullish patterns dominate the conversation, traders are urged to remain vigilant. Fibonacci levels and historical data suggest both opportunities and challenges ahead as Bitcoin continues its journey through this critical phase.
This article is for informational purposes only and does not constitute investment advice. Readers should conduct their own research before making any financial decisions.
Share This


