SUI Bulls Eye Breakout as $3.86 Resistance Holds Market’s Attention

SUI is entering a pivotal phase ahead of May 19, trading just under $3.86, a key resistance that has repeatedly capped upward momentum. With current price at $3.82, and a modest gain of 0.54%, traders are watching closely to see whether bulls can force a breakout or whether another rejection will keep the token trapped in its consolidation range.

Price Holds the Line at $3.66 as Bulls Maintain Pressure
Since breaking above $4.00 earlier in May, SUI has traded between $3.66 and $3.85, with $3.66 emerging as a critical support level. This range defines the current battlefield between buyers and sellers. The support at $3.66 stems from the uptrend that began earlier in May, and every dip toward this level has so far been met with renewed buying.
On the upside, $3.85–$3.86 has been a wall — a resistance zone that the bulls need to decisively clear to confirm momentum.
If price can breach $3.86, upside targets are $4.08 to $4.20, a zone that previously acted as heavy resistance. This move would signal a possible resumption of the bullish trend.
Momentum and Technical Indicators Hint at Breakout
Multiple technical signals suggest a breakout could be imminent:
-
RSI (4H) stands at 55.73, indicating mild accumulation.
-
MACD (30-minute chart) shows a bullish crossover, with rising green bars pointing to increasing upward momentum.
-
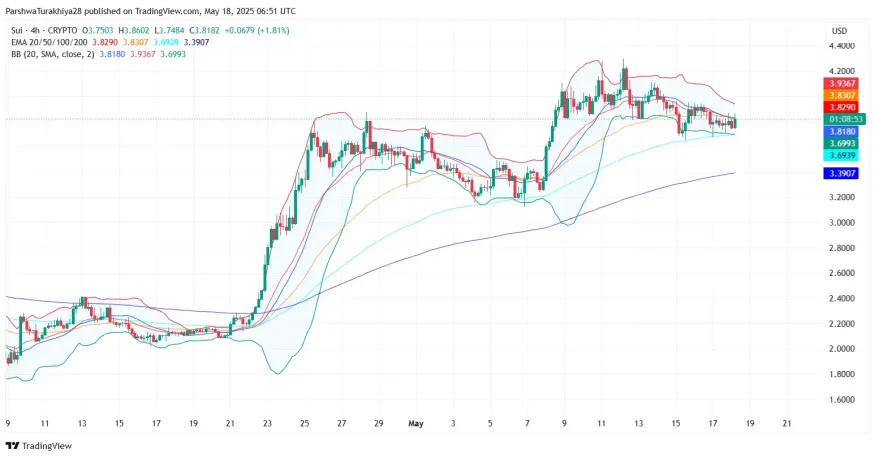
Bollinger Bands (4H) are tightening, a signal that volatility is about to increase.
-
The 20-EMA and 100-EMA are both clustering around $3.81, supporting a breakout scenario.
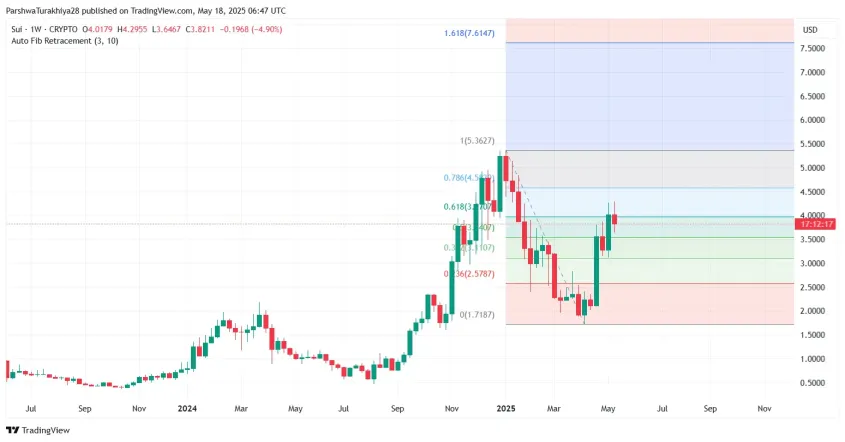
On the Ichimoku Cloud, a bullish crossover is visible on short-term timeframes, reinforcing optimism. The Fibonacci retracement level at $3.71 continues to serve as a buffer for price action, while the 0.786 extension projects a target near $4.55 if the breakout succeeds.
However, if buyers lose steam and $3.66 fails, the price could drop as low as $3.20 or even $2.90, where deeper support lies.
Conclusion: Critical Moment for SUI Traders
As May 19 approaches, SUI stands at a technical crossroads. A breakout above $3.86 could open the door to meaningful upside, while failure to defend $3.66 risks a sharp retreat. Traders are now focused on volume confirmation and price behavior at these thresholds to determine the next move.
SUI Key Technical Levels Summary
| Indicator/Level | Value/Zone | Bias/Impact |
|---|---|---|
| Current Price | $3.82 | Neutral-Bullish |
| Immediate Resistance | $3.85–$3.86 | Key Breakout Zone |
| Target on Breakout | $4.08 – $4.20 | Upside Potential |
| Short-Term Support | $3.66 | Crucial Support |
| Breakdown Risk Level | $3.20 | Bearish Trigger |
| RSI (4H) | 55.73 | Mild Accumulation |
| MACD (30m) | Bullish Crossover | Early Momentum Shift |
| Bollinger Bands (4H) | Tightening | Imminent Volatility |


