HYPE Token Charts a Path to $128: Is This Hyperliquid’s “Solana Moment”?
Fractals, Fibonacci Levels, and a Potential 240% Surge by July Signal Explosive Growth for HYPE
Hyperliquid’s native token, HYPE, is tracing a bullish price pattern eerily similar to Solana’s 2021 breakout, and if the fractal continues to hold, traders may see gains of up to 240% by July.
Currently trading at $38.24, HYPE surged 270% from April lows near $10, reclaiming its 1.0 Fibonacci retracement level ($35.88). Technical analysts are now setting their sights on $128, the 4.618 Fib level, as a possible rally peak—mirroring SOL’s 291% leap in early 2021.
HYPE’s Price Structure Mirrors Solana’s Historic Run
SOL/USD daily price chart. Source: TradingView
In January 2021, Solana (SOL) broke free from a long accumulation phase, surging from $4.90 to $19 in under two months. That move was ignited by a break above key Fibonacci zones, culminating in a 291% gain. Analysts now observe similar technical behavior unfolding with HYPE.
Fast forward to May 2025, and HYPE’s daily chart is forming the same structure. Its RSI has moved above 84, indicating strong bullish momentum despite short-term overbought conditions. The setup is nearly identical to Solana’s RSI profile before its breakout.
HYPE/USD daily price chart. Source: TradingView
If the pattern continues to play out, HYPE may reach $51.68 next (1.618 Fibonacci extension) before possibly rallying to $128—a 240% increase from the breakout zone.
Why Analysts Are Comparing Hyperliquid to Solana and FTX
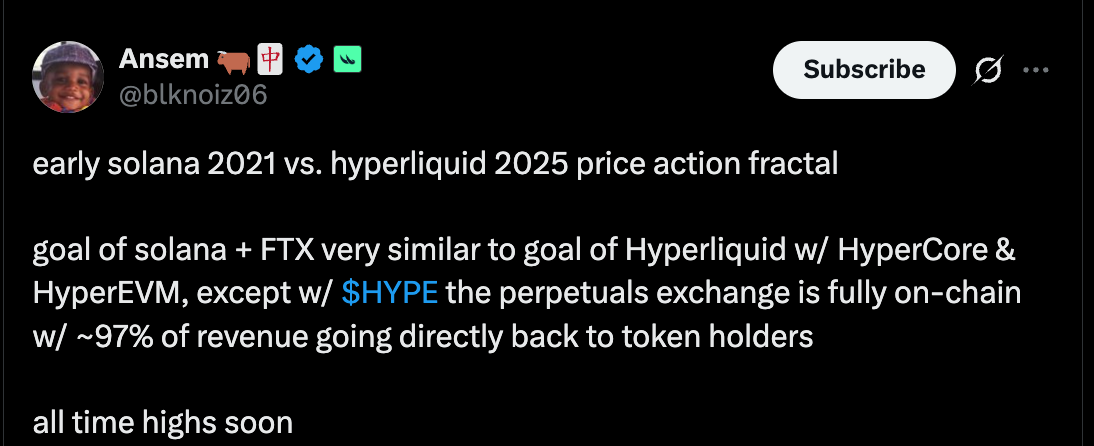
Crypto analyst Ansem likens Hyperliquid to “Solana and FTX combined,” praising its fully onchain architecture and high-speed performance.
Unlike FTX’s centralized model, Hyperliquid distributes nearly 97% of trading revenue back to HYPE tokenholders, a fundamental that could accelerate capital inflow.
Source: X/Ansem
Ansem believes that such strong fundamentals, paired with a familiar price trajectory, could push HYPE toward all-time highs. Traders, especially those with memories of Solana’s meteoric rise, may feel this setup is too familiar to ignore.
Historical patterns often repeat themselves in crypto. In 2017, Ethereum mimicked Bitcoin’s 2013 parabolic top and retracement cycle, and traders who saw that pattern early were well-positioned.
Now, as HYPE begins to mirror Solana’s 2021 breakout visually and structurally, the resemblance is fueling speculation that another explosive run is just beginning.
BTC/USD and ETH/USD fractal comparison chart. Source: TradingView
Rhapsody of Realities is a life guide that brings you a fresh perspective from God’s Word every day. It features the day’s topic, a theme scripture, the day’s message, the daily confession and the Bible reading plan segment. It is God's Love Letter to You!