Bitcoin vs Gold: Historic Bottom Signals Flash as BTC Bulls Fight to Hold $70,000
Bitcoin is showing signs that its 14-month bear market against gold may be approaching an end. Technical indicators on the BTC/gold ratio have reached levels that, in every previous cycle, marked the point where Bitcoin stopped losing ground to the precious metal and began a significant recovery. Whether history repeats depends largely on one number: $70,000.
BTC/Gold Ratio Flashes Classic Reversal Setup
The relationship between Bitcoin and gold has been a reliable long-term gauge of risk appetite and crypto market cycles. When investors rotate into gold, the ratio falls. When confidence returns to Bitcoin, it climbs. Right now, after 13 months of sustained decline, the ratio is sitting at historically oversold levels — and the technical picture is starting to turn.
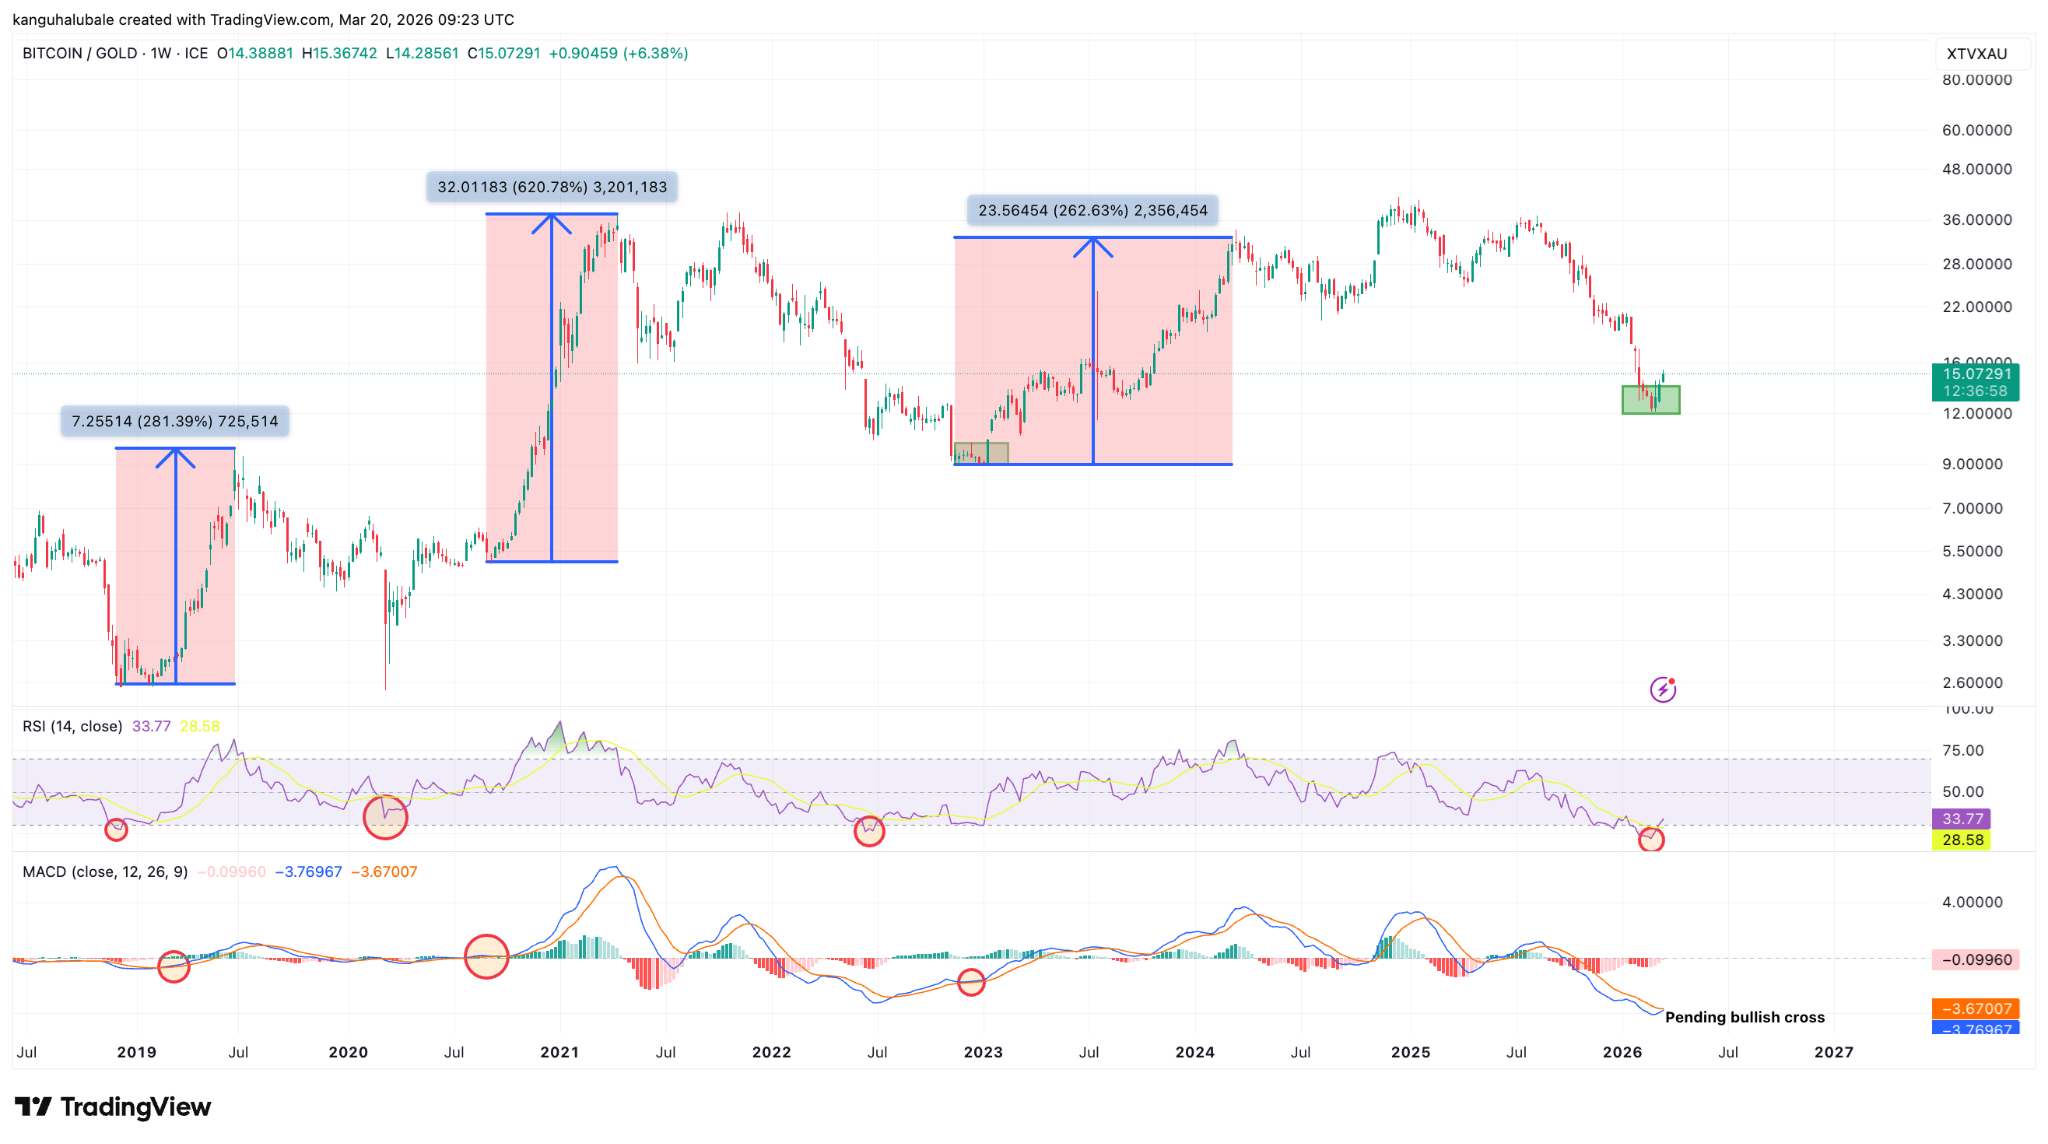
According to data from TradingView, the weekly Relative Strength Index of the BTC/gold ratio hit a low of 21 in mid-February — its most oversold reading in years. Since then, RSI has recovered to 33, indicating that selling pressure is fading even if conviction has not fully returned.
More significantly, the Moving Average Convergence Divergence indicator has dropped to its lowest level ever recorded and is on the verge of printing a bullish cross. That combination — an RSI recovering from deeply oversold territory alongside a MACD buy signal — has appeared at the bottom of every major BTC/gold bear market on record. In 2019, 2021 and 2023, similar setups preceded Bitcoin price breakouts of between 280% and 620% against gold.
Technical analyst James Easto put it plainly in a post on X: “Bottom is in for BTC vs Gold,” adding that the “stage is set” for Bitcoin’s recovery.
Thirteen Months In — The Pattern Fits
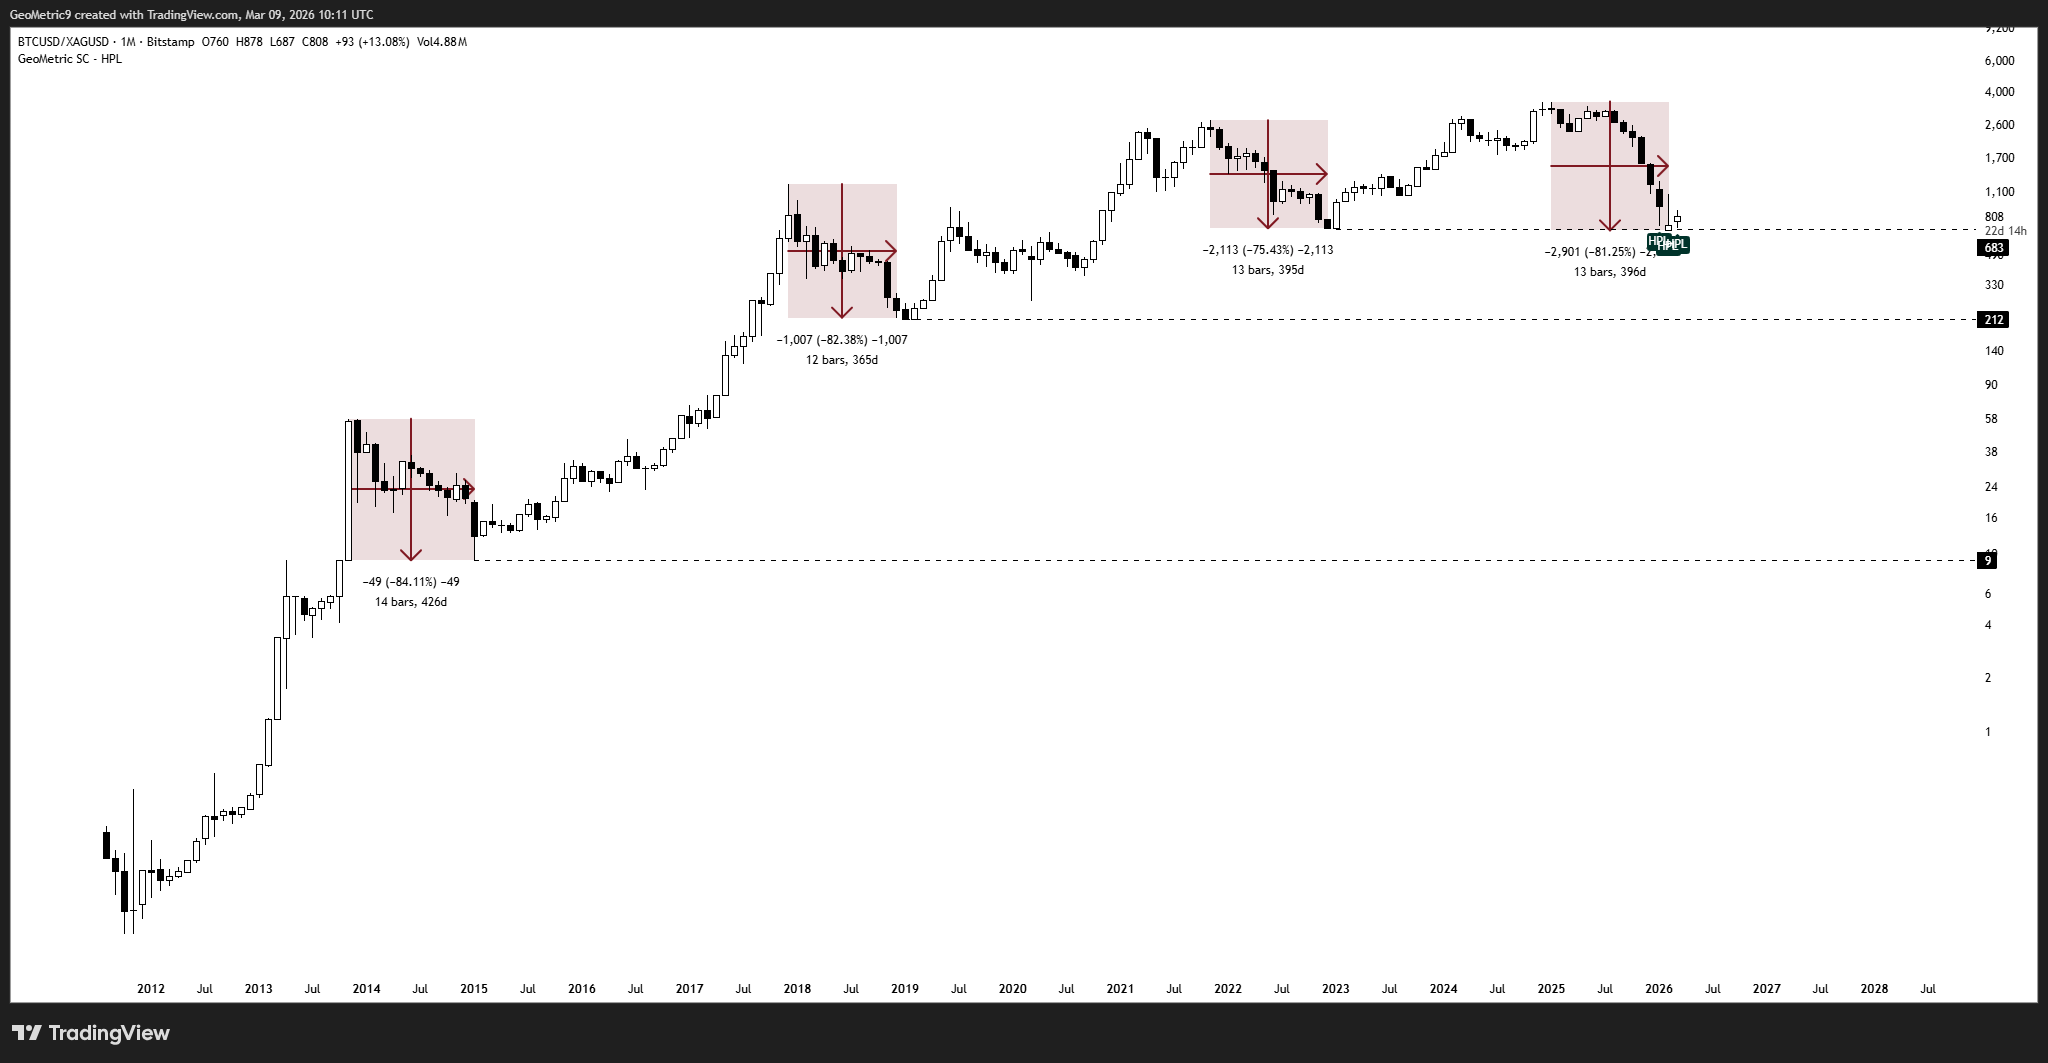
Analysts at GeoMetric have mapped the duration and depth of Bitcoin’s previous bear markets against gold, and the current cycle sits squarely within historical bounds. The past three BTC/gold bear markets lasted between 12 and 14 months, with drawdowns ranging from 75% to 84%. The current cycle is approximately 13 months old and has registered an 81% decline — deeper than the 2021 bear market but still within the expected range.
“I think there is a solid case for a potential bottom here,” GeoMetric noted.
Analyst Crypto Fergani reinforced the point with a longer-term perspective: over 13 years of market history, Bitcoin has consistently entered bear markets against gold lasting roughly 400 days, during which the RSI falls into deeply oversold territory before reversing. “Historically, these phases have always marked the bottom,” he said.
For context, the last confirmed bottom in the BTC/gold ratio came in November 2022. What followed was a 700% Bitcoin price rally that carried BTC to its current all-time high of $126,000. No two cycles are identical, but the structural similarities are difficult to ignore.
The Line in the Sand: $70,000
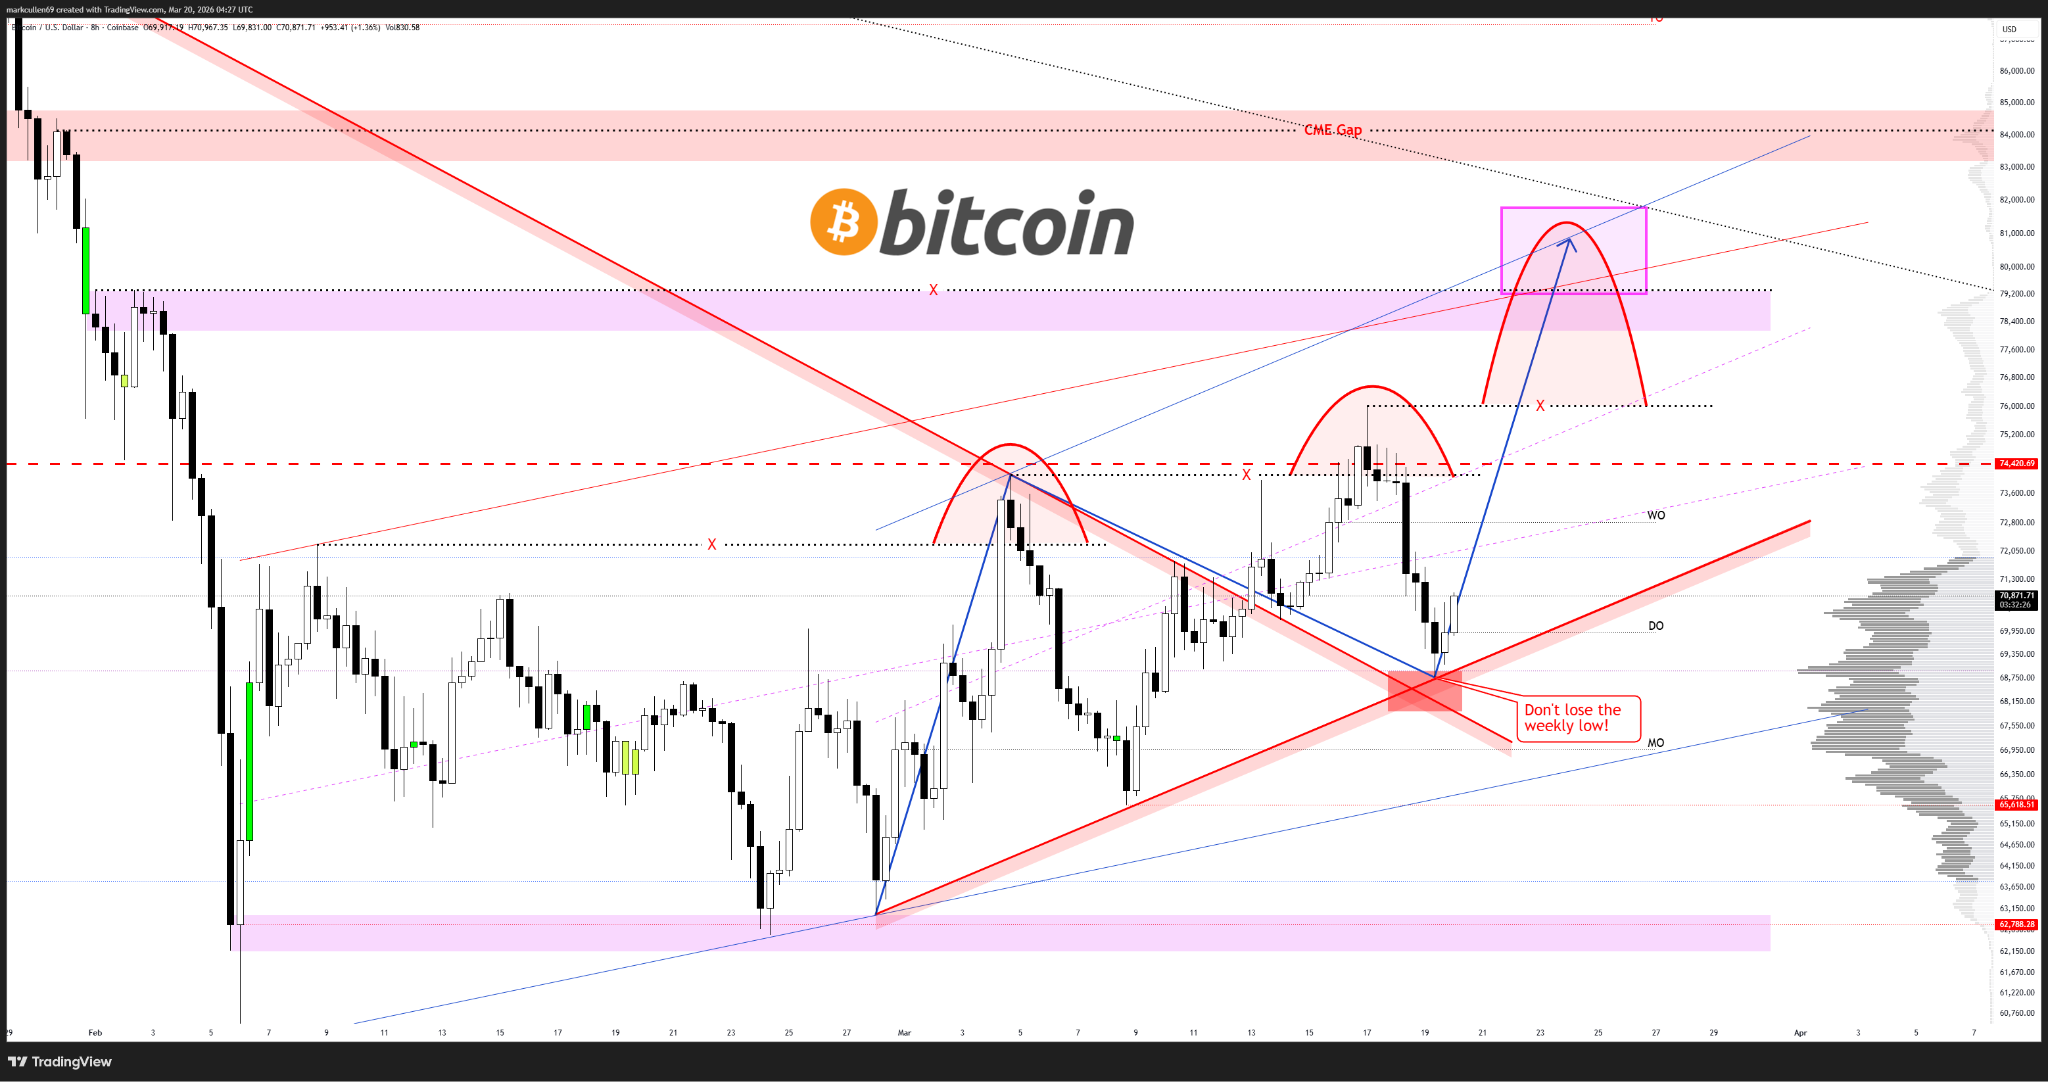
While the BTC/gold technical picture is encouraging, Bitcoin’s price in dollar terms faces its own critical test. The $68,000–$70,000 zone has emerged as a key support band, where both the 200-week exponential moving average and the 50-day simple moving average converge.
The 200-week EMA has historically acted as a floor during Bitcoin bear markets — a level where long-term buyers have repeatedly stepped in. Analysts have flagged this week’s Sunday close as a moment of particular importance, warning that the EMA’s reliability as support could face a genuine test.
Bitcoin analyst AlphaBTC stated he expects a recovery toward $80,000 before any potential move lower toward $50,000, but only on the condition that price holds above the weekly low of $68,800. “I don’t want to see this week’s low lost, otherwise it’s going to break back down to range lows or lower,” he cautioned.
The broader roadmap, as previously reported, suggests that holding $70,000 would keep open a path toward the $76,000–$80,000 range — a zone that would represent meaningful technical recovery and likely reignite retail interest.
What Comes Next
The signals are aligning, but signals are not certainties. Bitcoin has tested patience before, and the $70,000 level needs to hold on a weekly closing basis to validate the bullish case. A breakdown below $68,800 would shift the narrative considerably, raising the prospect of a deeper correction before any sustained recovery takes hold.
What gives the current setup its weight is the convergence of multiple independent indicators — RSI recovery, a pending MACD cross, historical cycle timing and the 200-week EMA support — all pointing toward the same conclusion at roughly the same time. Markets do not always follow the script, but when this many technical factors align, traders tend to pay attention.
For Bitcoin bulls, the message from the charts is clear: hold the line at $70,000, and the next major move could be up.
Share This


