Bitcoin Traders Split: Will BTC Sink to $60K or Rally Toward $140K?
Market Divides After 12.75% Drop From Record High
Bitcoin (BTC) has fallen more than 12.75% from its recent peak above $124,500, sparking fierce debate over whether the market is facing a deeper correction or setting up for another rally.

One camp warns that history is about to repeat, sending Bitcoin sharply lower. The other argues the current dip is a routine pullback within a broader bull market — with room for BTC to soar as high as $140,000.
Fractals Point to $60,000 Risk
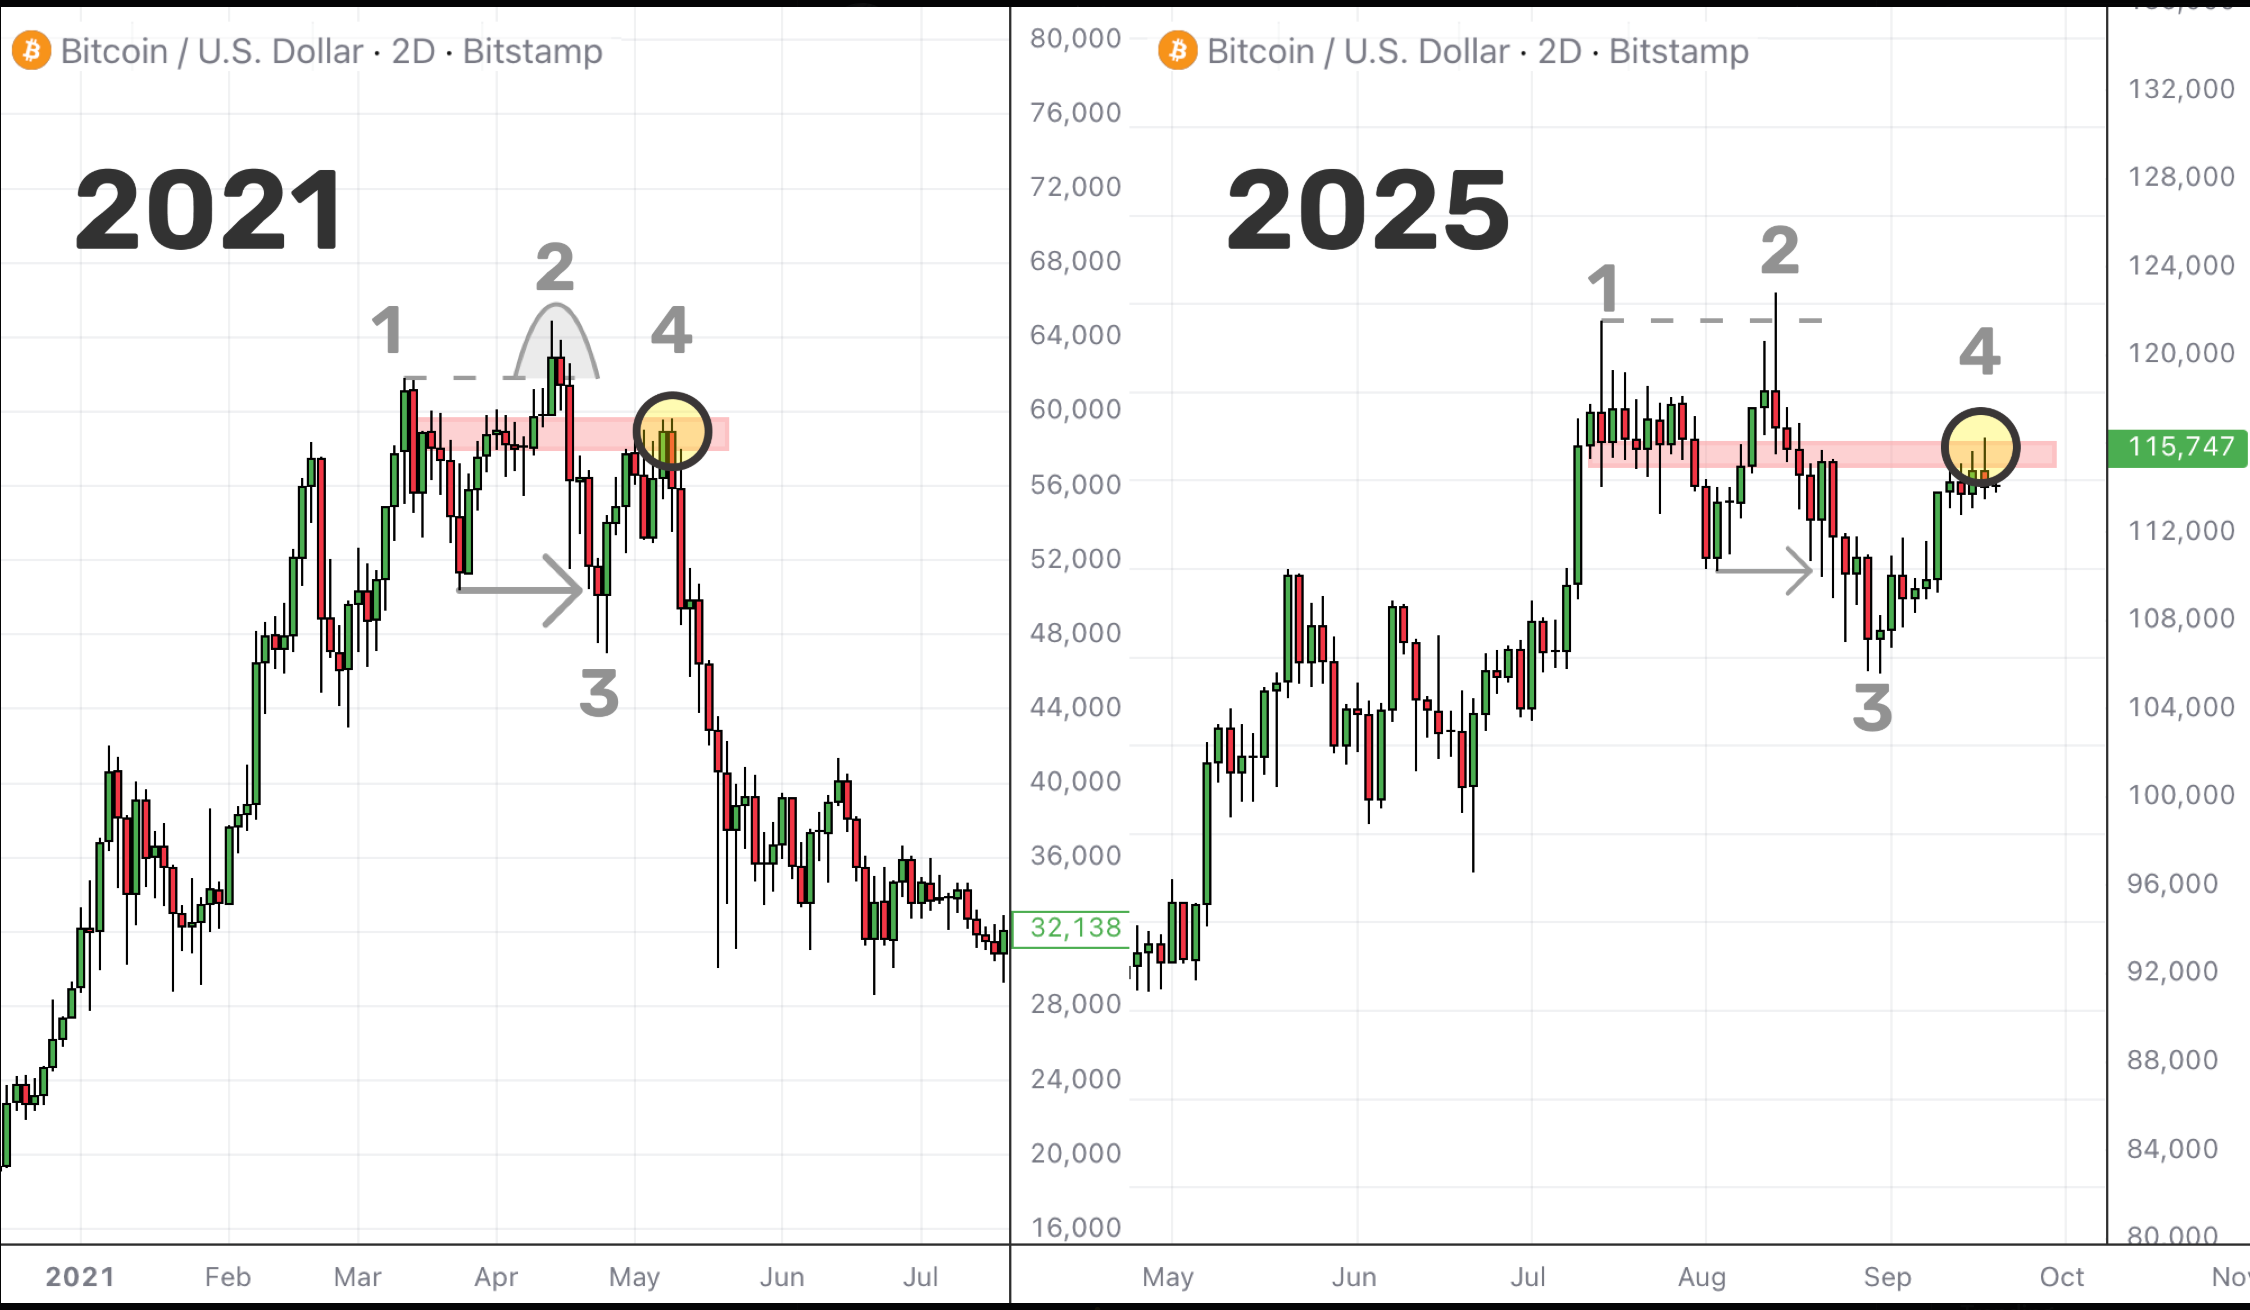
Analysts warn that Bitcoin’s 2025 price structure now mirrors the same pattern that led to the 2021 top. Back then, BTC surged to nearly $69,000 before a failed retest sparked a brutal 50% correction down to $32,000.
Crypto analyst Reflection notes that BTC is again hovering under a distribution zone that previously marked the bearish reversal.
On the weekly chart, Bitcoin has also broken below a rising wedge pattern, a historically bearish signal. The breakdown could send prices tumbling to the $60,000–$62,000 range, an area that overlaps with the 200-week exponential moving average (EMA).
Some analysts have gone further, suggesting BTC could test the $50,000 zone if selling accelerates.
Bulls See $104K Support, Eye $140K Rally
Not everyone agrees that a crash is imminent.
Trader Jesse points out that BTC’s 200-day simple and exponential moving averages, now in the $104,000–$106,000 range, have historically acted as strong support in bull markets.
Analyst Bitbull adds that the U.S. Business Cycle, a key macroeconomic indicator, has not yet peaked. Historically, markets top after this cycle turns. With the Federal Reserve cutting interest rates, he argues Bitcoin could enjoy another three to four months of upside.
Meanwhile, analyst Captain Faibik believes BTC is forming a bull flag pattern. A decisive breakout above $113,000 could confirm this setup and open the way to $140,000 in the coming months.

A Market at a Crossroads
With forecasts ranging from $50,000 to $140,000, the Bitcoin market remains deeply divided. What is clear is that Bitcoin’s next decisive move — whether a sharp rejection or a breakout to new highs — will likely set the tone for the rest of 2025.


