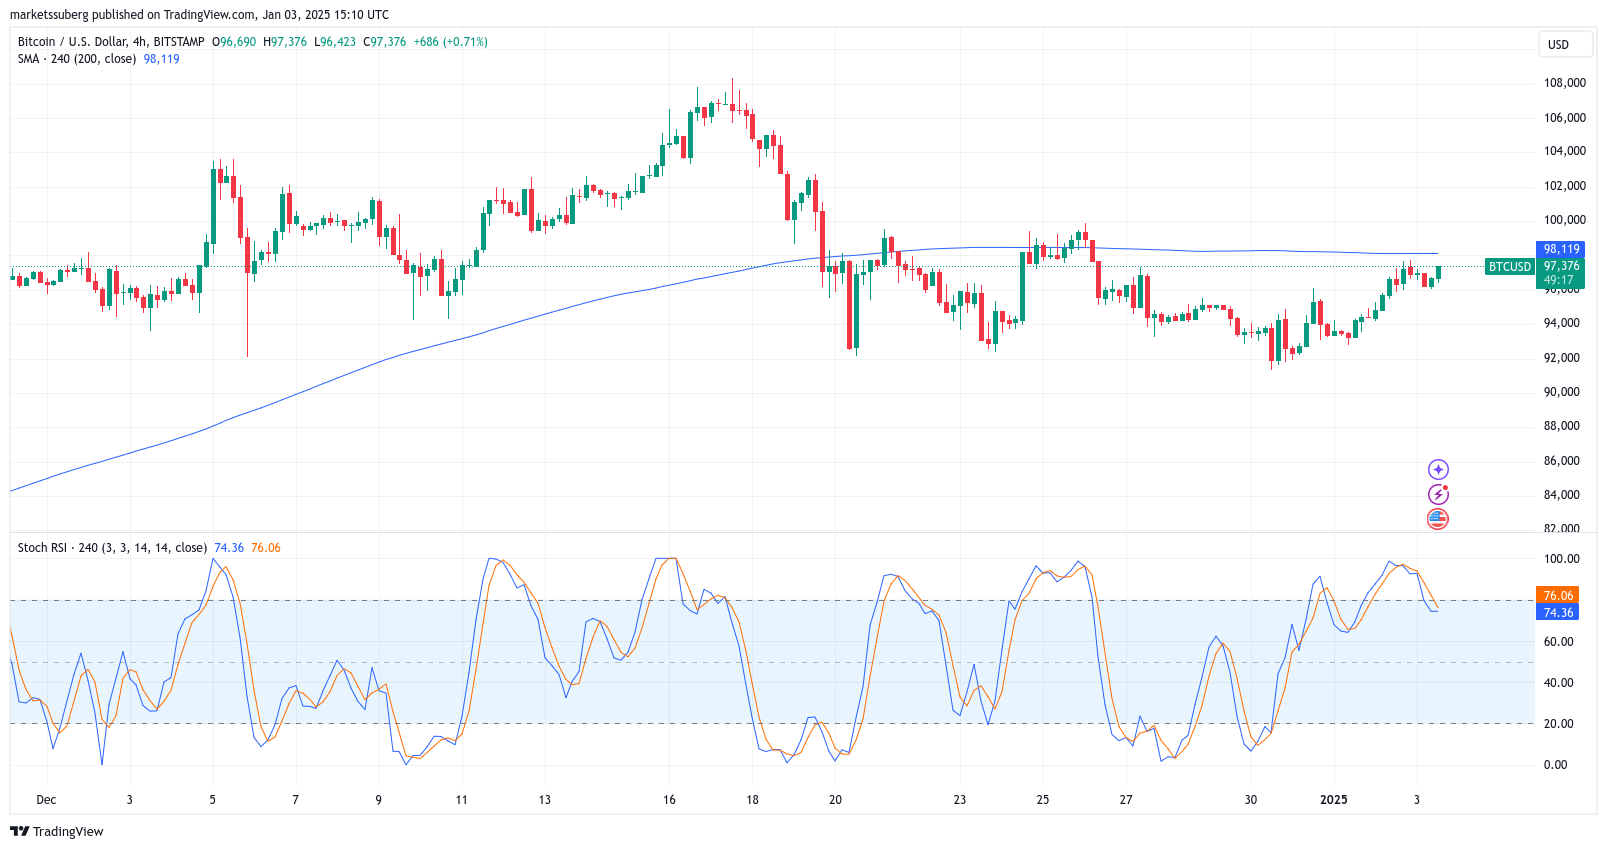
Bitcoin Bulls Push for $97K: Key Resistance Levels to Watch
Bitcoin (BTC) continues to test critical resistance levels as traders position themselves for potential bullish momentum. At the January 3 Wall Street open, BTC briefly crossed $97,000, eyeing higher targets while traders remain cautious about short-term dips.
Bitcoin Tests Key Moving Averages
Data from Cointelegraph Markets Pro and TradingView shows BTC/USD retesting the 50-day simple moving average (SMA) at $96,740. This level had acted as support for over two months before Bitcoin slipped below it in late December.
Popular trader SuperBro noted the importance of reclaiming both the 20-day and 50-day SMAs to sustain the uptrend:
“Careful not to get aggressive with longs into potential resistance. Now we need to reclaim the 20 and 50 SMA and flip these back to support.”

Resistance Levels to Beat
Market participants highlighted several critical resistance and support levels:
- $98,000+: According to Daan Crypto Trades, breaking above this level could trigger a run toward all-time highs. He noted the importance of the 4-hour 200-period SMA, which acts as a barrier to higher prices.
- $95,000: A key short-term support level identified by traders, holding this range is essential to maintain bullish momentum.
- Volume Node: Bitcoin is trading near a high-volume node, which represents areas of significant trading activity. A decisive move away from this range could lead to rapid price shifts.
“The 4H 200EMA below offers support. A break above $98K+ will start the run back to the all-time highs,” Daan Crypto Trades told his followers.

Caution Amid Bullish Sentiment
Despite the optimism, some analysts urged caution. Roman, a trader examining shorter timeframes, pointed to low volume and an overbought stochastic RSI (Relative Strength Index):
“We’ve got a low volume pump with maxed stoch RSI. Generally means we come down a bit.”
Roman and others believe the current move could be a short-term rally, potentially leading to a corrective dip.
Buying the Dip
While some expect short-term resistance, analysts like BitQuant are positioning for a buying opportunity in the event of a pullback. BitQuant has suggested a potential dip toward $80,000 before Bitcoin resumes its uptrend.
“When the dip comes, you should buy, not sell,” BitQuant advised, noting that market overexuberance often precedes corrective phases.

What’s Next for Bitcoin?
The battle for $97,000–$98,000 is pivotal. Breaking above these levels could pave the way for a return to all-time highs, while failure to hold $95,000 might trigger further corrections.

Traders should watch:
- The 4-hour 200-period SMA and EMA for short-term directional clues.
- Volume trends, which could indicate whether Bitcoin can break away from its high-volume trading range.
- Broader market signals, including equity trends and macroeconomic factors, which continue to influence Bitcoin’s price dynamics.
Stay tuned for updates as Bitcoin navigates these crucial levels, with both bulls and bears closely monitoring the action.
Share This


