Bitcoin Rebounds 17%, but $78,000 Remains the Critical Level for a Trend Reversal
Analysts Say Buyers Are Regaining Control as Market Tests Key Resistance
The price of Bitcoin has staged a notable recovery, climbing 17% from recent lows below $60,000, yet market analysts warn that the broader downtrend will not end unless the cryptocurrency breaks and holds above the $78,000 level.
Recent market data suggests that buyers are slowly returning to the market, pushing Bitcoin toward the mid-$70,000 range. However, analysts say the current move still resembles a relief rally within a broader bearish cycle, rather than a confirmed long-term trend reversal.
Derivatives Data Signals Renewed Buying Pressure
Net Taker Volume Shows Buyers Outpacing Sellers
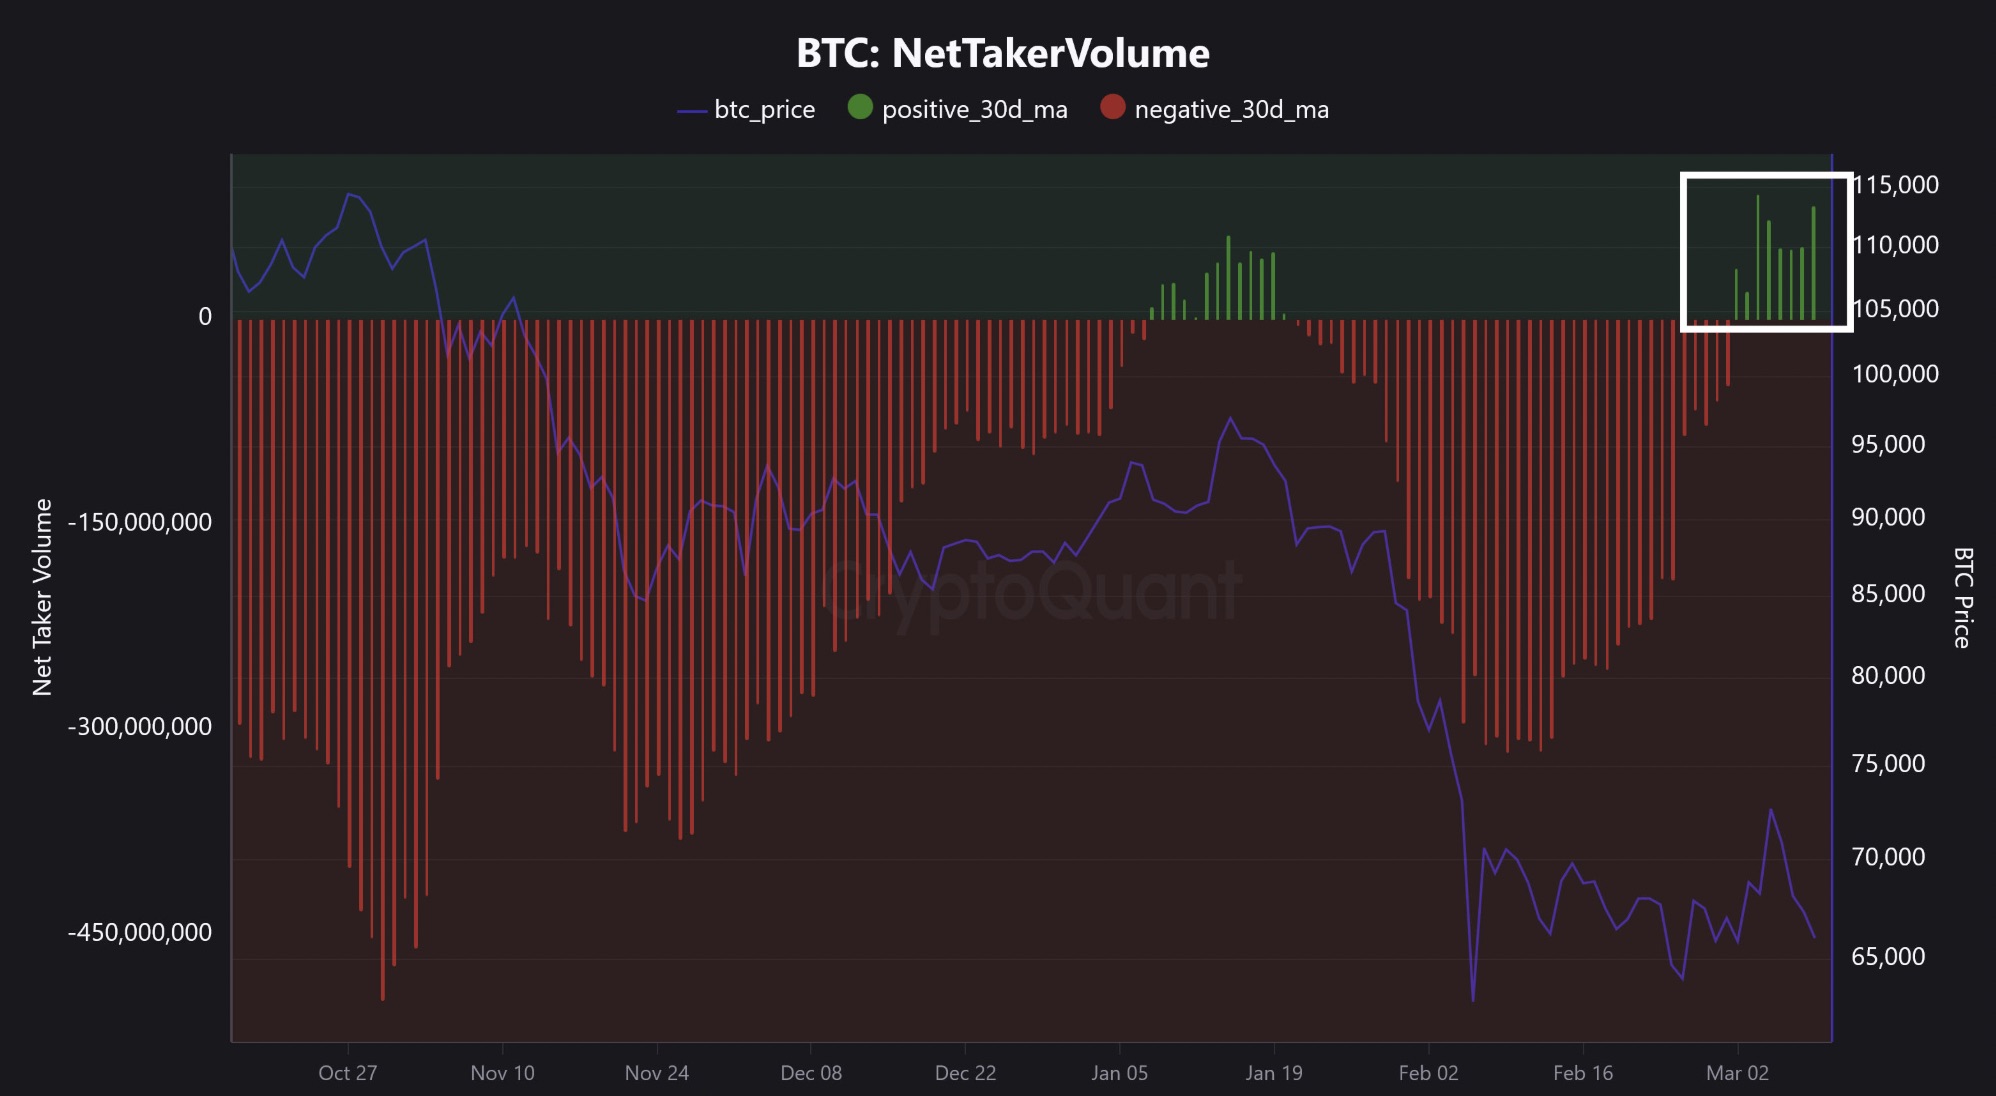
On-chain analytics from CryptoQuant indicate that demand for Bitcoin derivatives has increased, with the platform’s net taker volume metric turning positive.
Net taker volume measures the imbalance between aggressive buyers and sellers in derivatives markets. When the figure remains positive, it suggests buy orders are dominating sell orders.
According to Nic Puckrin, CEO of Coinbureau, the indicator has remained positive since the escalation of the Israel–Iran conflict escalation.
“Since the conflict broke out, net taker volume as measured by the 30-day moving average has been positive,” Puckrin wrote in a social media post.
The shift coincided with Bitcoin’s recovery to roughly $74,000, suggesting that buy-side demand has returned across derivatives markets.
“Bitcoin buyers are in control,” Puckrin added.
Bitcoin Net Taker Volume
Market Health Improves, but Bear Market Conditions Persist
Another indicator reinforcing the recovery narrative is the Bitcoin Bull Score Index, which evaluates market health using a mix of technical and fundamental signals.
According to Julio Moreno, head of research at CryptoQuant, the index has climbed from 10 on March 6 to 30, marking its highest reading since October 2025.
Despite the improvement, Moreno cautioned that the market has not yet exited bearish territory.
“We are still in a bear market, but in a relief rally,” he said.
At the same time, demand from institutional investors continues through spot Bitcoin investment vehicles.
Data from SoSoValue shows three consecutive days of inflows into U.S. spot Bitcoin ETFs, totaling $529.2 million.
$78,000 Identified as the Key Breakout Level
Analysts Say Price Must Clear Major Resistance
Market data from TradingView indicates that Bitcoin has spent more than four weeks trading within a $62,000–$72,000 range, repeatedly struggling to maintain momentum above $70,000.
Research from Glassnode suggests the cryptocurrency is currently trading between two major cost-basis levels:
-
Realized price: about $54,400 (average acquisition cost of circulating supply)
-
True market mean: around $78,000 (cost basis of actively transacted coins)
Historically, relief rallies during bearish cycles have often stalled at the true market mean, making the $78,000 level a decisive threshold for the market.
If Bitcoin can push above $78,000–$80,000, analysts say it could signal a broader long-term trend shift.
Major Support Levels Still in Focus
Key Technical Floors Below the Current Market
While attention remains fixed on the $78,000 resistance, analysts are also watching several downside support levels:
-
$68,300 — 200-week exponential moving average
-
$60,000–$65,500 — key demand zone
-
$58,800 — 200-week simple moving average, historically the final support during macro downturns
-
$54,000–$54,400 — realized price, considered the primary structural support level
Repeated failures to hold above $70,000, according to Glassnode analysts, increase the probability of downward pressure in the medium term.
For now, Bitcoin appears caught between renewed buyer interest and strong resistance overhead—a standoff that could determine the market’s next major direction.
Share This


