How High Can Bitcoin Go? Analysts Eye $120,000 and Beyond
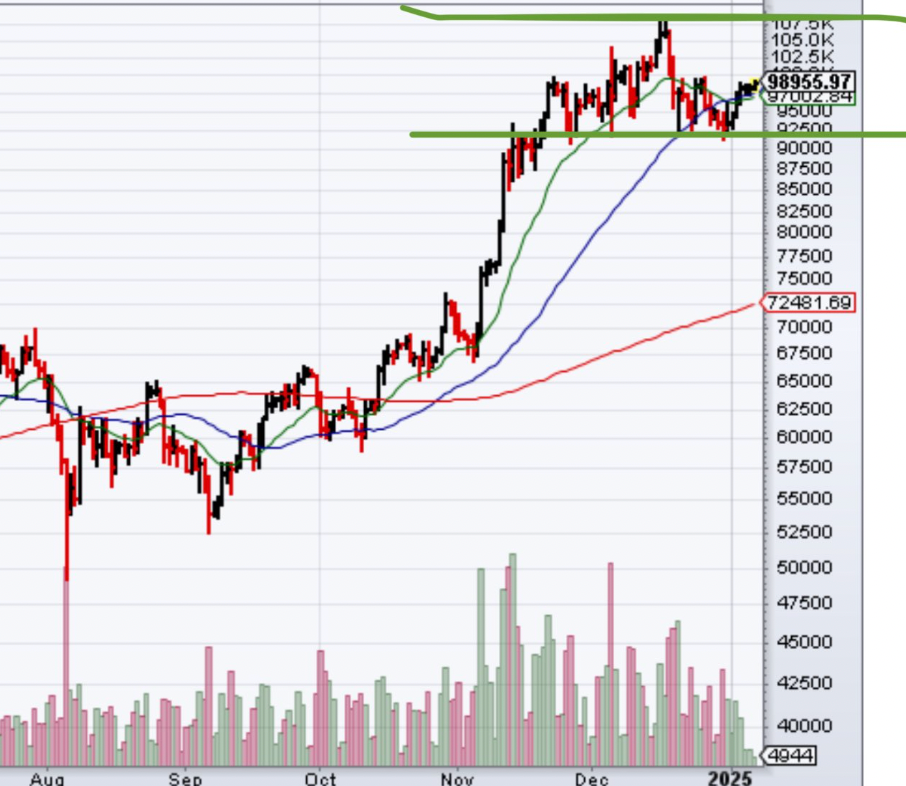
Bitcoin’s recent surge above $100,000 for the first time in three weeks has ignited market optimism, with analysts predicting new milestones for the leading cryptocurrency. Following a 2.3% rise on Jan. 7, Bitcoin’s price reached $102,760, its highest since Dec. 19, 2024. As the rally gathers momentum, questions arise: how high can Bitcoin climb in the coming months?
Bitcoin Breaks $100K: Market Analysis
Data from Cointelegraph Markets Pro and Coinbase shows Bitcoin’s ascent from a low of $91,315 on Dec. 30 to a high of $101,942, marking an 11.8% gain. This breakthrough above $100,000 has prompted a wave of ambitious predictions for BTC’s next targets.

Analysts Project Bitcoin’s Next Moves
Bitcoin’s strong recovery has led analysts to set bullish price targets:
- WealthSquad Chris predicts Bitcoin will reach $120,000 next. In his technical analysis shared on X, Chris highlighted BTC breaking out of consolidation, suggesting a clear path to higher resistance levels.
“Breaking $100K could pave the way to $120K,” Chris noted.
- Mike Alfred, a crypto investor, envisions even greater heights. He projects Bitcoin could hit $200,000, with further targets at $315,000, $500,000, and $700,000 in this bull cycle.
“There is zero downside impulse left,” Alfred stated, adding that minor retracements to $95,000 or $96,000 could occur before the next rally.

Fibonacci Extensions Suggest $450,000 Potential
Using Fibonacci retracement levels, crypto analyst MartyParty estimates Bitcoin could target between $172,000 and $450,000. According to historical patterns, BTC has consistently surpassed key Fibonacci extension levels. The next hurdle is the 1.0 Fibonacci extension at $107,500, which could pave the way for higher targets, such as the 4.236 level at $450,000.

Technical Patterns: Bull Flag Points to $175,000
From a technical standpoint, Bitcoin’s weekly chart shows the formation of a bull flag pattern—a bullish indicator typically leading to significant price rises. If this pattern holds, BTC’s price could climb to $175,700, representing a 73% upside from current levels.
Additionally, Bitcoin’s daily relative strength index (RSI) remains positive at 69, signaling market conditions still favor further gains.

Conclusion: Can Bitcoin Reach New Highs?
With its recent rally, Bitcoin is regaining its status as a market leader. Analysts are optimistic about BTC’s trajectory, pointing to key milestones like $120,000, $175,000, and beyond. Fibonacci levels and bullish chart patterns add weight to these predictions, while the current market sentiment, marked by an RSI of 69, supports continued growth.
As Bitcoin pushes past $100,000, traders and investors are watching closely. While retracements may occur, the broader trend suggests Bitcoin could challenge new all-time highs in the near future.


