Price analysis 1/3: BTC, ETH, XRP, BNB, SOL, DOGE, ADA, AVAX, LINK, TON

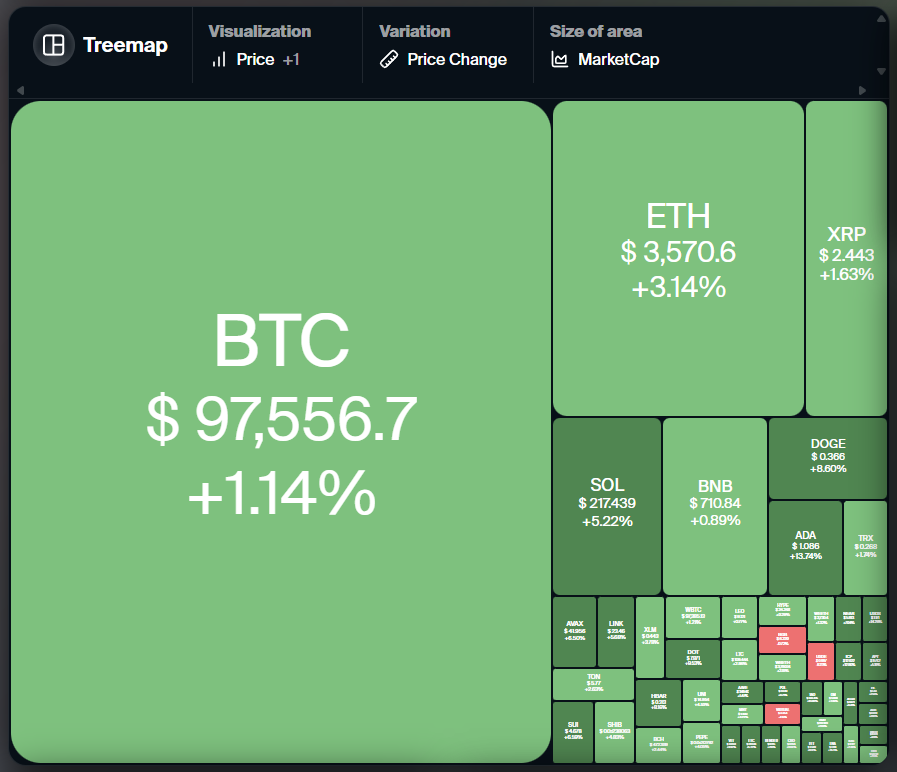
As Bitcoin approaches the critical $100,000 mark, the broader crypto market is showing mixed signals, with altcoins poised to follow Bitcoin’s trajectory. Here’s an analysis of the top 10 cryptocurrencies.
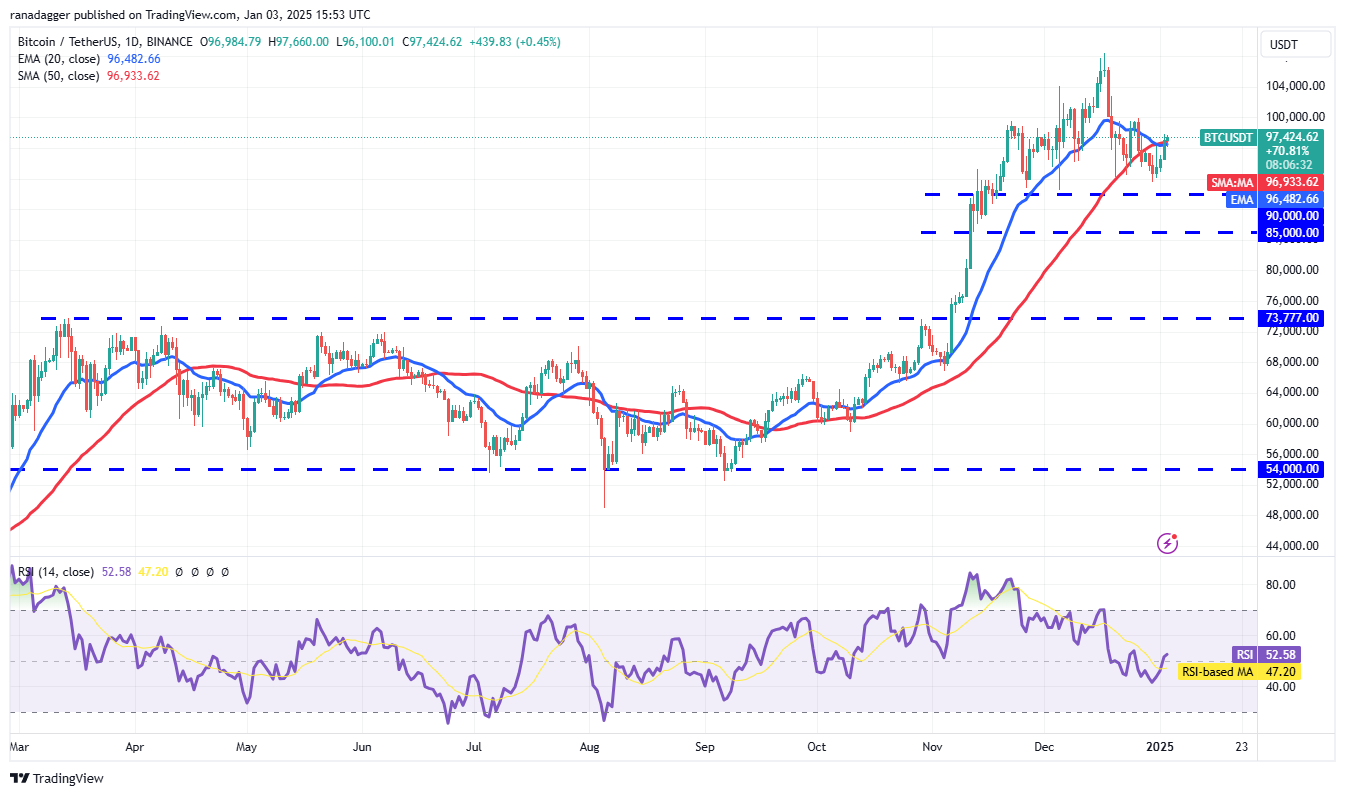
Bitcoin (BTC)
Current Price: $98,673
Analysis: Bitcoin’s price recovery has been strong, but resistance at $100,000 remains stiff. The moving averages have flattened, indicating a likely consolidation between $90,000 and $100,000 in the near term.
- Key Levels:
- Upside: Break above $100,000 could lead to a retest of the all-time high at $108,353.
- Downside: Drop below $90,000 may open doors to $85,000.
Bitcoin price analysis
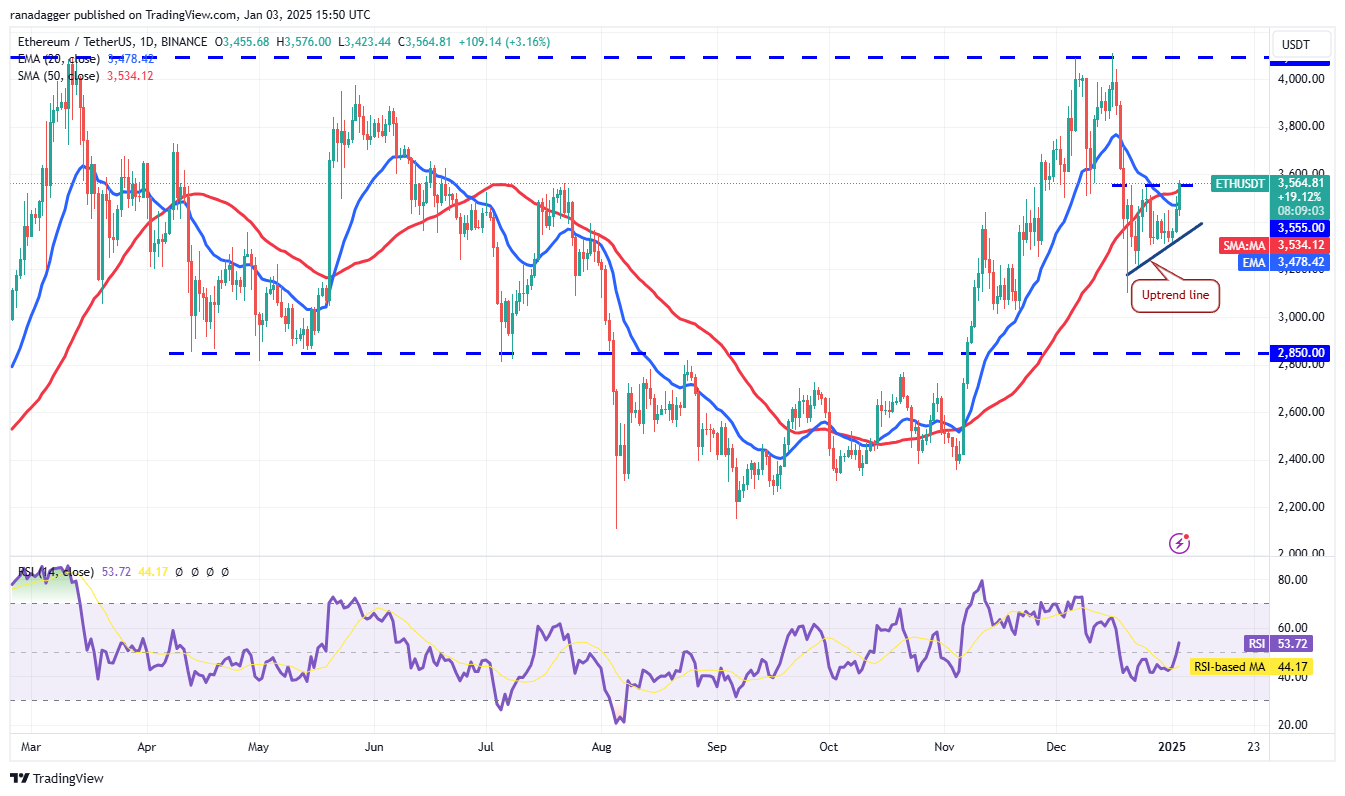
Ether (ETH)
Current Price: $3,622.27
Analysis: ETH is forming an ascending triangle pattern, a bullish indicator. A close above $3,555 could propel it to $3,894.
- Key Levels:
- Support: If ETH breaks below the uptrend line, it could fall to $3,100 or $3,000.
- Resistance: A move above $3,555 would confirm the bullish pattern.
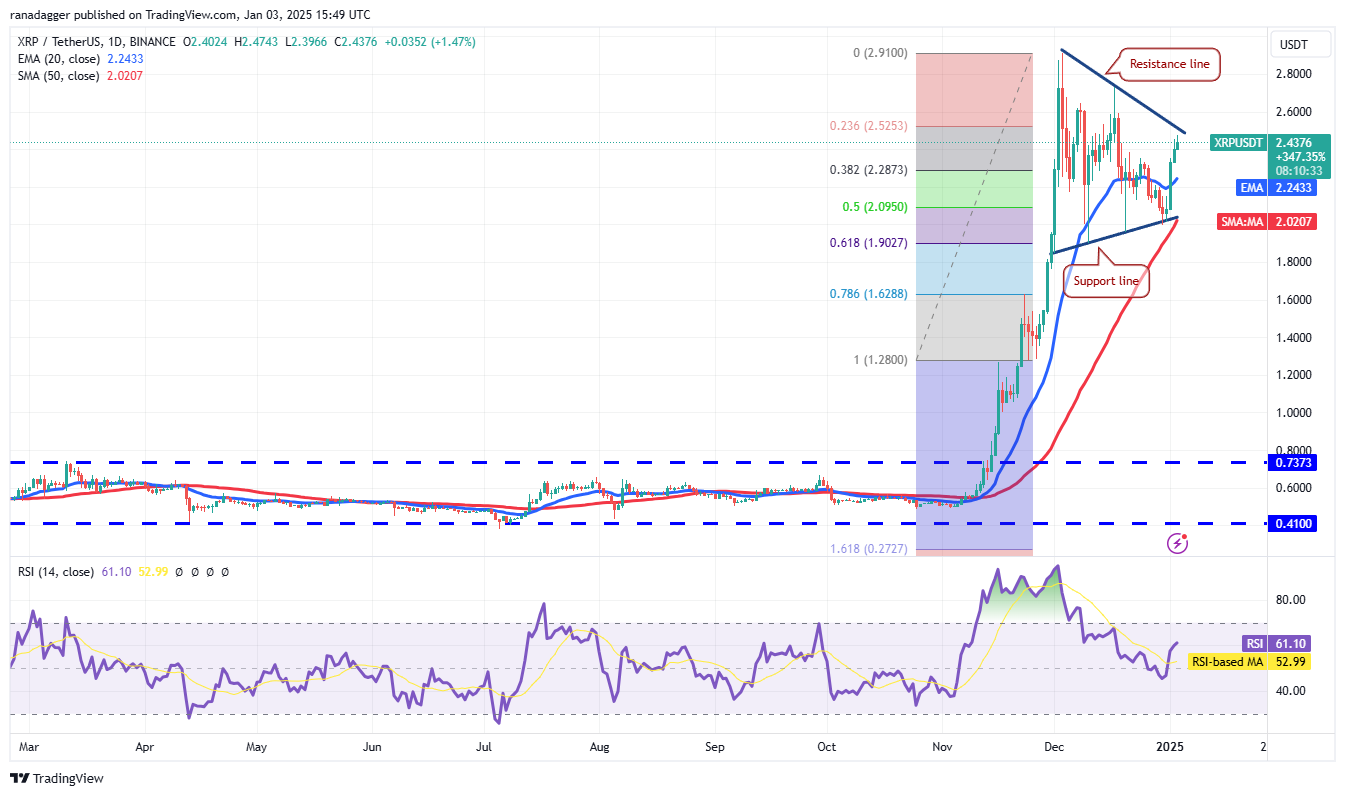
XRP
Current Price: $2.46
Analysis: XRP is trading within a symmetrical triangle, indicating uncertainty. A breakout above the triangle could trigger a rally to $2.91.
- Key Levels:
- Upside: Break above $2.91 to signal bullish momentum.
- Downside: Fall below $2.24 (20-day EMA) may keep XRP range-bound.
BNB
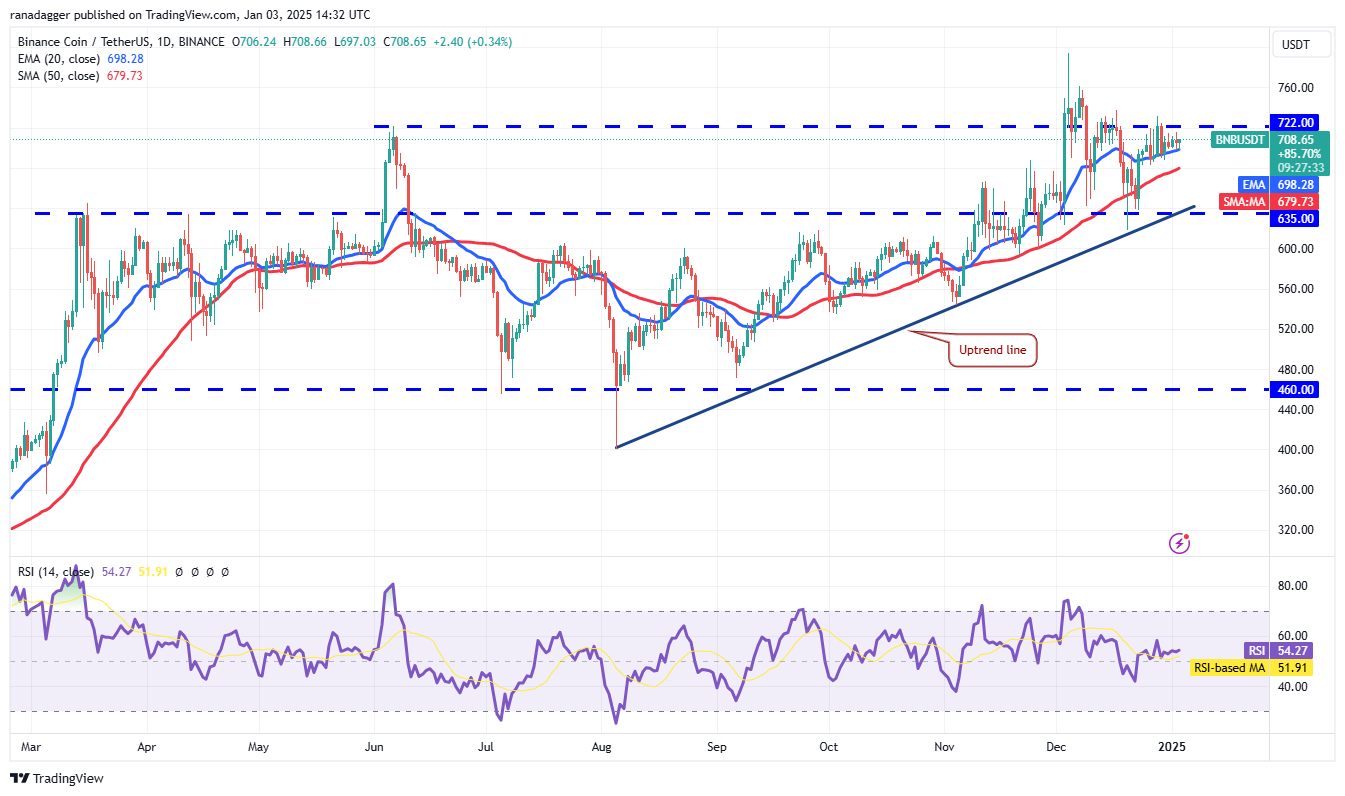
Current Price: $713.81
Analysis: BNB is consolidating between $698 (20-day EMA) and $722. A breakout could determine the next major move.
- Key Levels:
- Upside: Break above $722 could lead to $760 and eventually $794.
- Downside: Drop below $698 could push BNB to $635.
Solana (SOL)
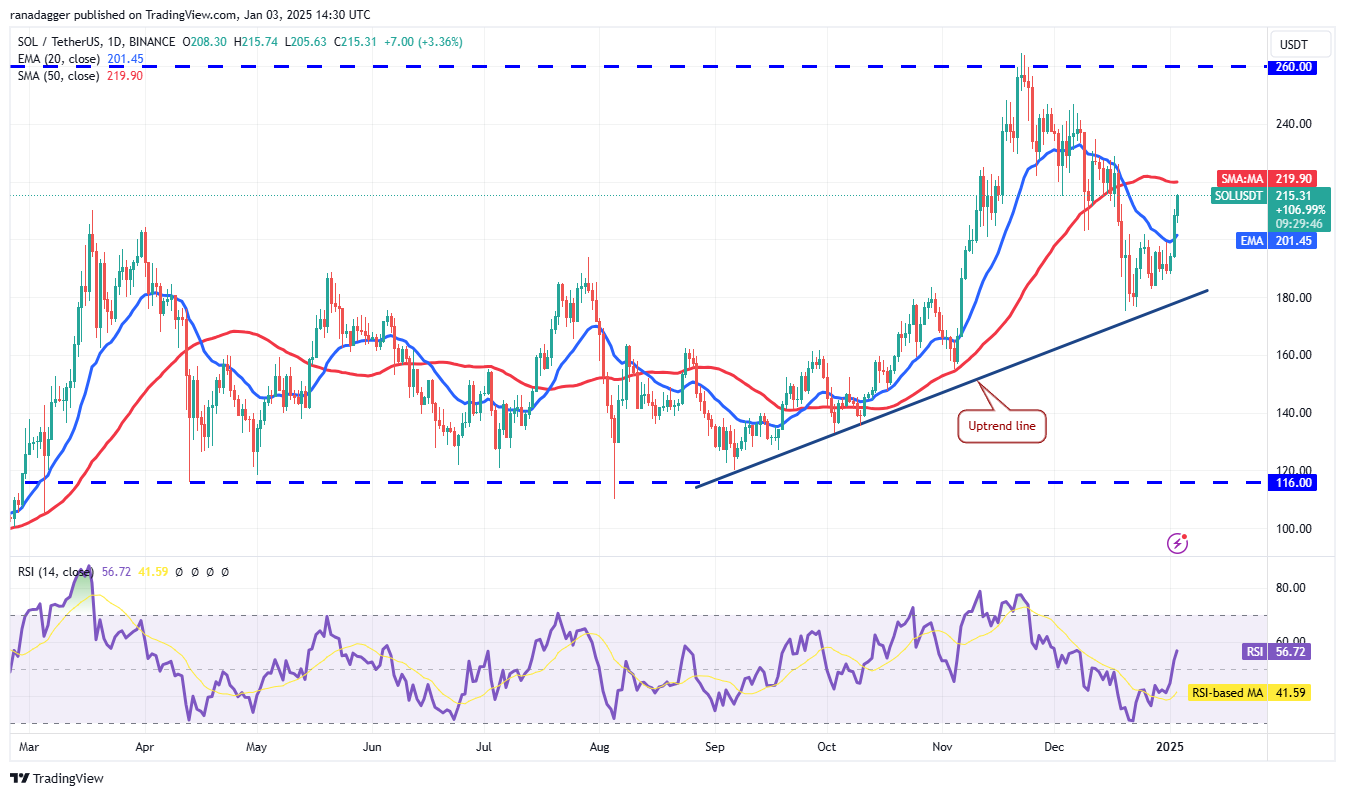
Current Price: $216.75
Analysis: SOL’s recovery above the 20-day EMA ($201) indicates reducing selling pressure. A challenge lies at the 50-day SMA ($219).
- Key Levels:
- Upside: A move above $219 could target $234.
- Downside: Drop below the uptrend line would reassert seller dominance.
Dogecoin (DOGE)
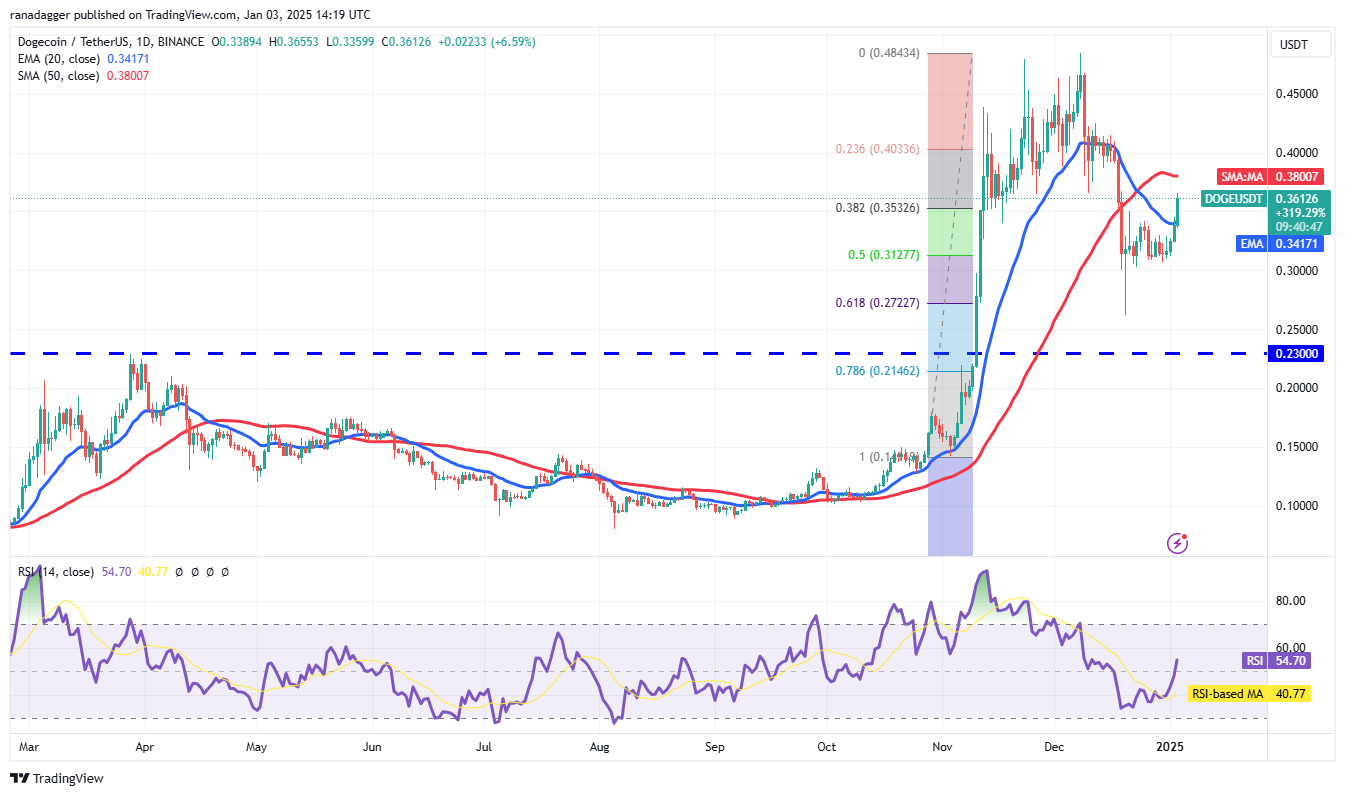
Current Price: $0.3783
Analysis: DOGE broke out of its range between $0.30 and $0.35, signaling bullish momentum. However, $0.42 poses strong resistance.
- Key Levels:
- Upside: Break above $0.42 could open the path to further gains.
- Downside: A dip below $0.30 could initiate a deeper correction to $0.27.
Cardano (ADA)
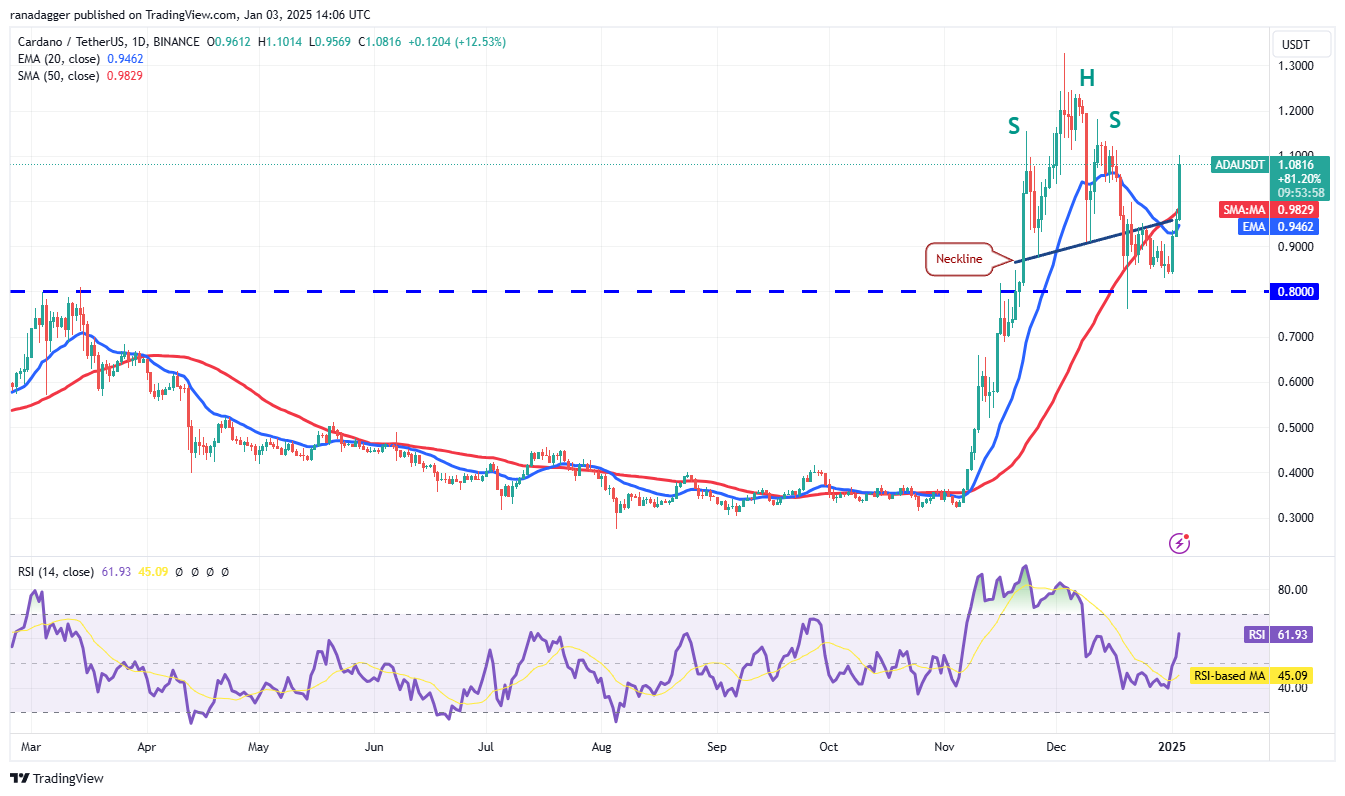
Current Price: $1.09
Analysis: ADA broke above the head-and-shoulders neckline, leading to a potential short squeeze. The rally could extend to $1.20–$1.33.
- Key Levels:
- Support: Moving averages are expected to provide support on pullbacks.
- Resistance: A failure to sustain above $1.20 may signal weakness.
Avalanche (AVAX)
Current Price: $41.99
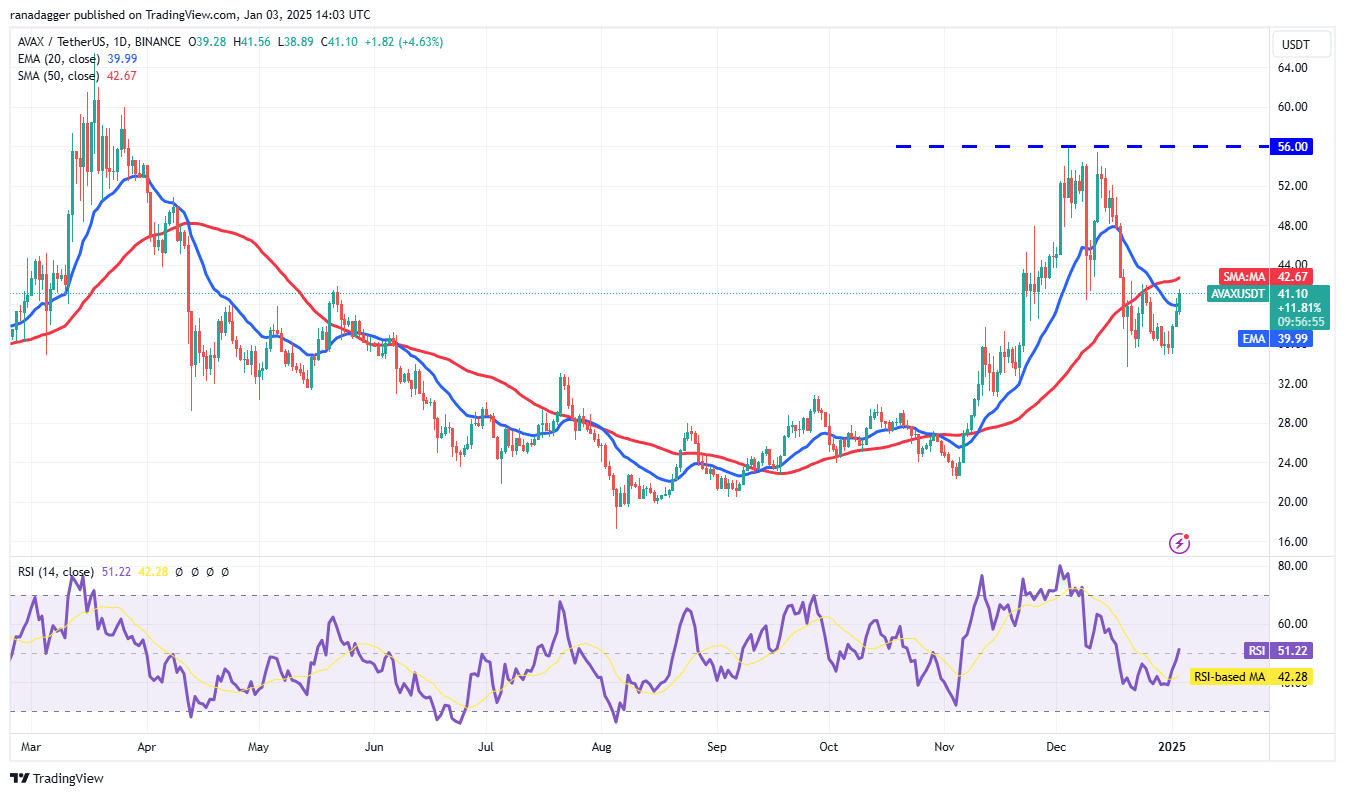
Analysis: AVAX bounced off $35 but faces resistance at the 50-day SMA ($42.67).
- Key Levels:
- Upside: Break above $42.67 could signal the end of the correction, targeting $48.
- Downside: A drop below $35 could drive the price to $32 or $30.50.
Chainlink (LINK)
Current Price: $23.86
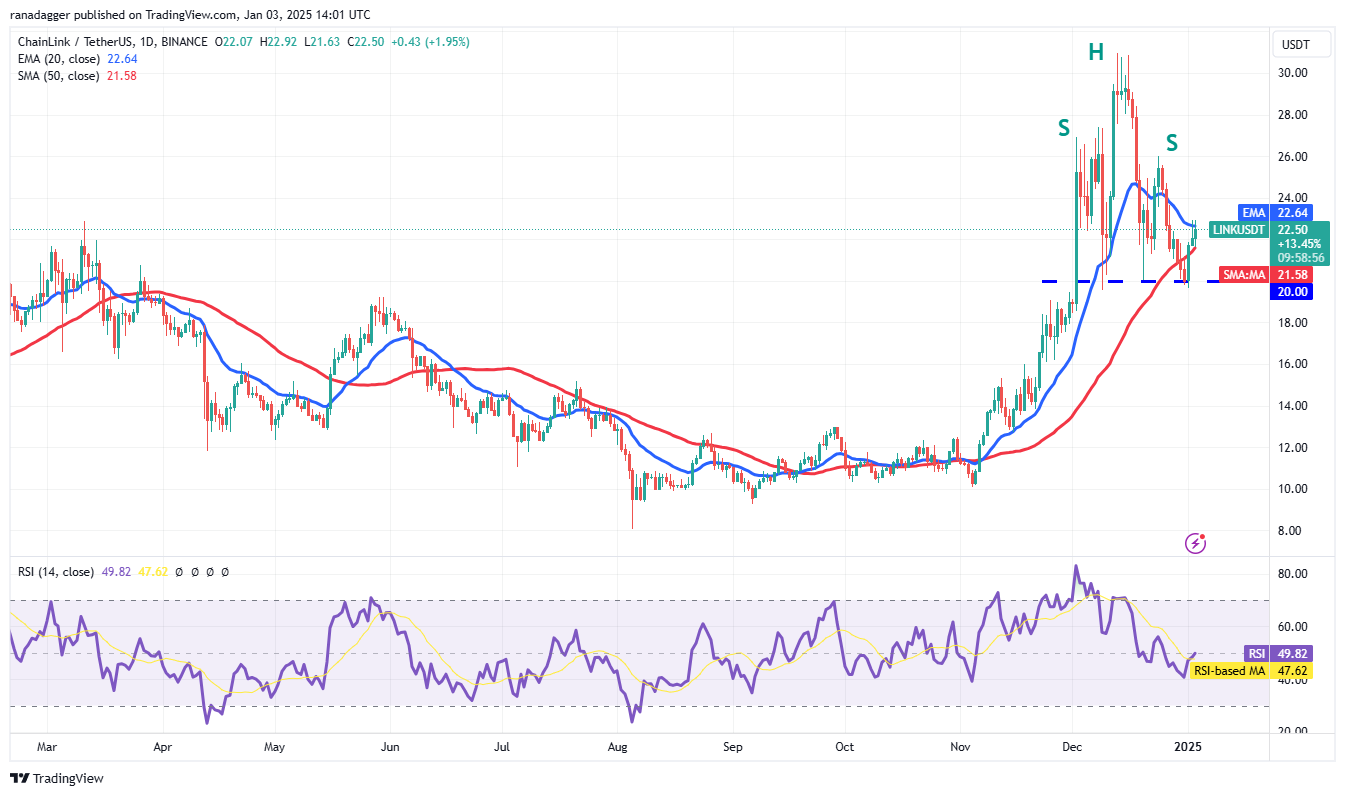
Analysis: LINK bounced off its H&S neckline, suggesting robust buying interest. Resistance lies at the 20-day EMA ($22.64).
- Key Levels:
- Upside: A push above $22.64 could lead to $26.
- Downside: Failure to hold $20 may confirm a bearish trend.
Toncoin (TON)
Current Price: $5.79
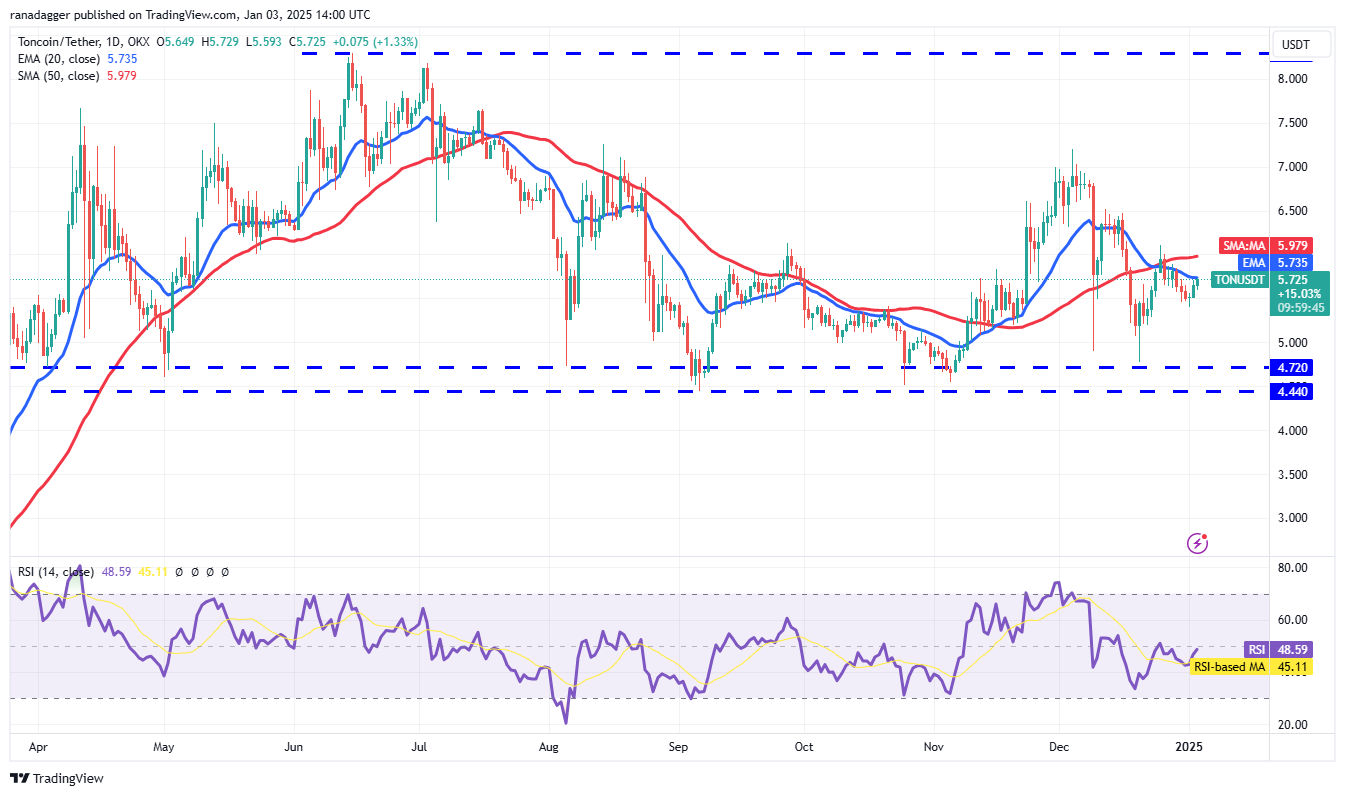
Analysis: TON is attempting a recovery but faces resistance at the moving averages.
- Key Levels:
- Upside: A break above $6.50 could lead to $7.
- Downside: A drop below $5.40 could deepen losses to the $4.44–$4.72 zone.
Conclusion
Bitcoin’s imminent test of the $100,000 resistance will likely dictate the direction of the broader crypto market. While altcoins show mixed trends, breakout opportunities in ETH, ADA, and SOL suggest potential gains if BTC continues its bullish momentum. However, key support levels must hold to prevent further corrections.
- Bitcoin Eyes $94,715 CME Gap Amid Weekend Consolidation: Key Levels to Watch
- Bitcoin’s SOPR Drops Below 1: Is This the Perfect Buying Opportunity as Price Hits $92K?
- Bitcoin Surges to $98K as Coinbase Premium Index Signals U.S. Demand Recovery
- Avalanche (AVAX) Price Prediction 2025-2031: A Detailed Outlook
- Bitcoin’s SOPR Drops Below 1: Is This the Perfect Buying Opportunity as Price Hits $92K?
- Bearish Bitcoin Chart Pattern Threatens Price Drop to $76K Before Trump Inauguration
- Bitcoin Struggles Below $100K as Select Altcoins Surge – Market Watch
- AVAX Eyes $126, DOGE Whales Drive Gains, and BlockDAG Nears $1 with Exchange Listings on the Horizon
- Will Bitcoin’s Momentum Spark an Altcoin Rally?
- Filecoin Poised for a 3,000% Pump: Analyst Sets $190.95 Target This Altseason
- Bitcoin Eyes Growth While Altcoins Struggle to Rebound
- Crypto Market Watch: Analyst Predicts Big Swings for Algorand and Polygon
- Crypto Market Soars: BTC, DOGE, RLBK, and AAVE Lead the Charge in 2025
- Bitcoin Faces Critical Support Levels as Nasdaq Signals Potential Market Shift
- Bitcoin Surges as Trump Bans CBDCs and Proposes a Digital Asset Reserve
- Bitcoin Price Analysis: Why BTC Dropped in February and What’s Next for 2025
- How High Can Bitcoin Go? Analysts Eye $120,000 and Beyond
- What Drives Bitcoin Demand in 2025? CryptoQuant CEO Breaks It Down
- Bitcoin Price Alert: Critical Support Tested—Will BTC Hold or Break Down?
- Bitcoin Surges 2% After Dropping Below $90K Amid Jamie Dimon Criticism; Best Wallet ICO Hits $7M


