XRP Enters the Summer with a Breakout Looming, Analyst Warns
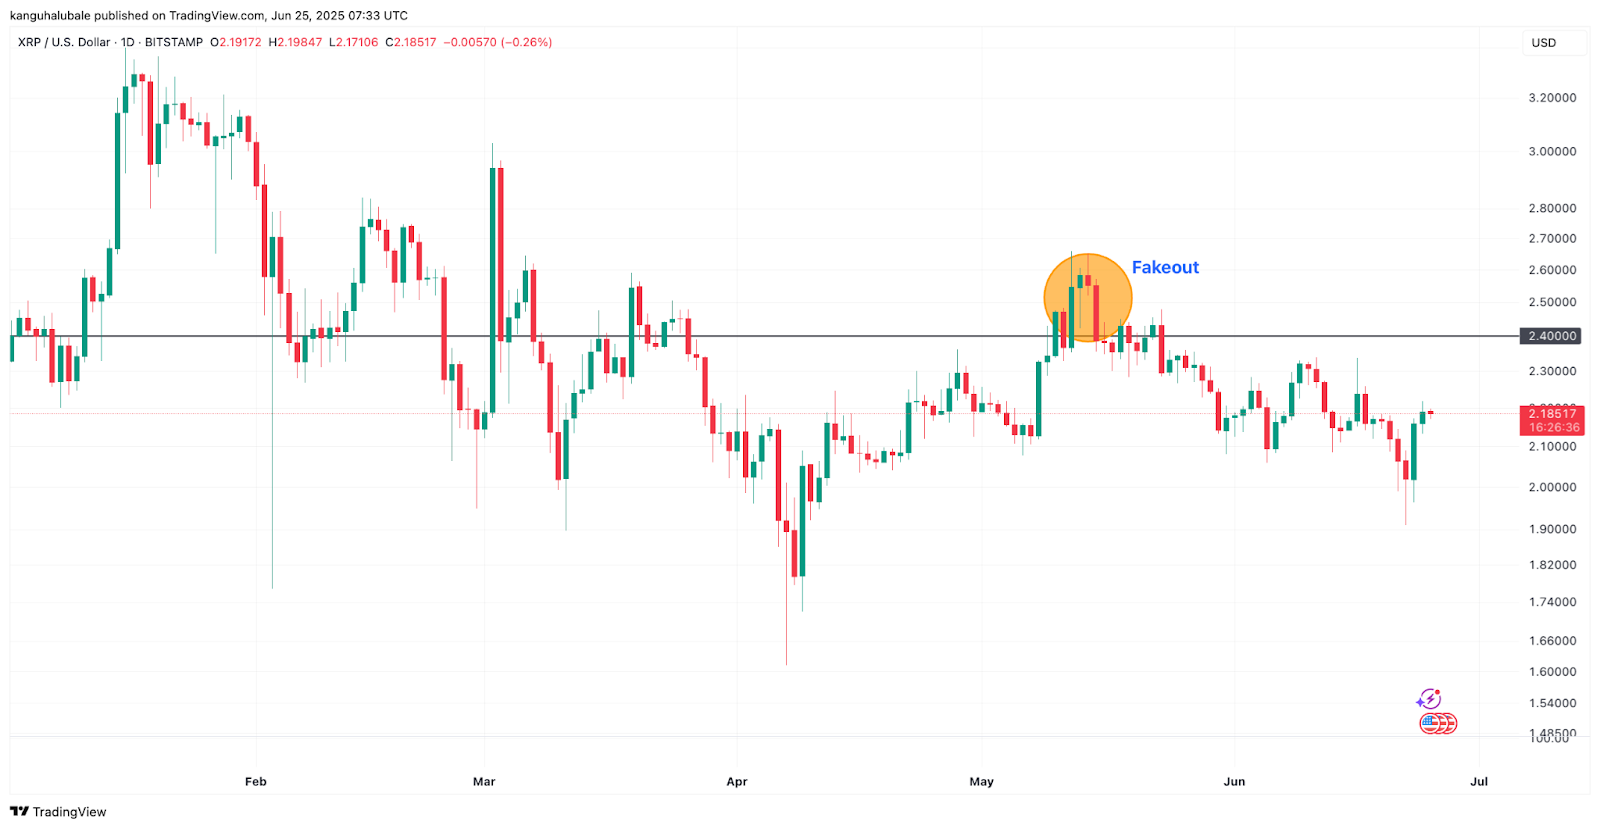
XRP’s price has remained in a tightening range between $2.00 and $2.40 for over three months, frustrating both bulls and bears in equal measure. But if one analyst is correct, the wait may be nearing its end.

Crypto strategist Egrag Crypto believes the altcoin is primed for a major upward breakout, likely to occur between early July and mid-September 2025, based on historical chart patterns and time cycles.
Symmetrical Triangle Could Spark Major Move
According to Egrag, XRP has been consolidating for 334 days inside a symmetrical triangle — a classic technical setup that typically resolves with a strong move in either direction. Historical analysis suggests such formations break out between 75% to 95% of their duration.
“This suggests the breakout could occur anytime between early July and mid-September 2025, so stay alert!” said Egrag Crypto on X (formerly Twitter).
Using Fibonacci extensions, Egrag projected ambitious price targets ranging from $8 to $27 once the breakout is confirmed.
Analysts Agree: XRP Under $2 May Soon Be History
Several analysts are echoing a bullish outlook:
-
DustyBC Crypto called XRP under $2 “incredibly cheap,” urging followers to “bookmark this post and look back in six months.”
-
Mikybull Crypto compared the current setup to XRP’s legendary 2017 rally, suggesting a possible run-up to $14.
-
CasiTrades said recent price action signals “momentum is back,” but cautioned that the token must break above $2.25 and then $2.69 to confirm a long-term bullish trend.
Technical Resistance Zones to Watch
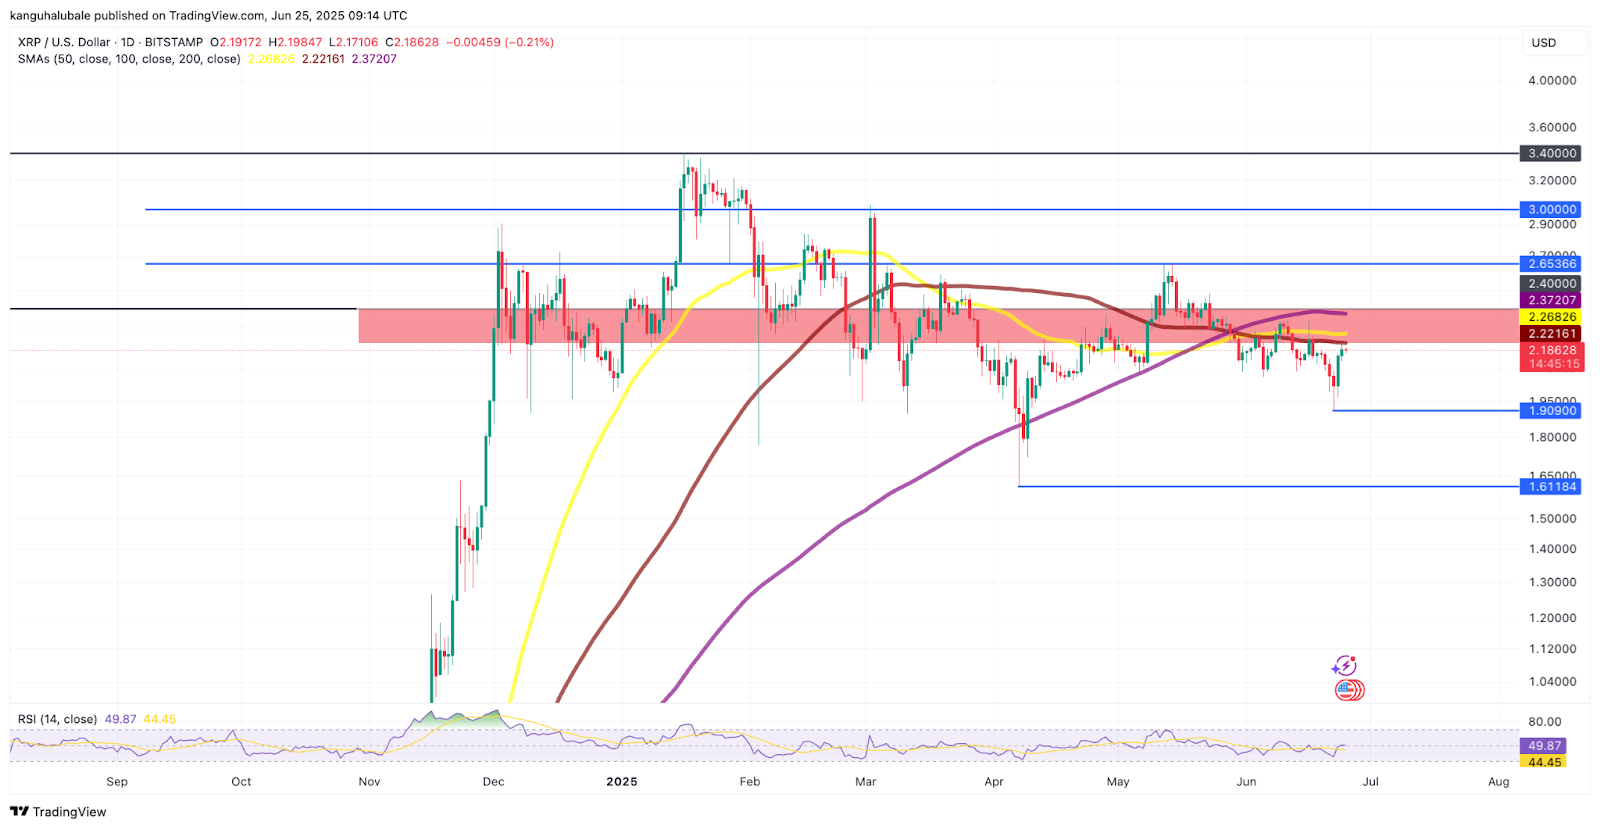
On Tuesday, XRP surged 15% from a local low of $1.91 to a high of $2.21, bringing it back into the resistance band between:
-
$2.22 (100-day Simple Moving Average)
-
$2.40 (200-day Simple Moving Average)
A sustained close above $2.40 would open the door to a retest of $3.00 and possibly its multi-year high of $3.40, last seen in January 2025.

Failure to break out above $2.22 risks validating bearish structures that could pull the asset down to $1.18, analysts warn.
Macro Fibonacci Levels Hold the Key
CasiTrades emphasized the importance of macro retracement levels, particularly:
-
$2.25 (.382 retracement)
-
$2.69 (.236 retracement)
“Clearing them with strength would confirm that this isn’t just a local reaction, but a true trend shift,” said CasiTrades.
Bottom Line: All Eyes on the $2.40 Barrier
XRP is at a critical inflection point. If bulls can reclaim $2.40 and hold it as support, analysts see an explosive rally ahead. If not, the token could risk falling into deeper consolidation or worse.
The clock is ticking on this consolidation. Whether XRP delivers on the bullish breakout—or slips back into range-bound frustration—will likely be decided before the end of September.


