Bitcoin’s Oversold Signal Could Push Price Toward $260,000
A rare megaphone pattern and panic among short-term holders hint at a possible rally
Bitcoin is showing signs of a major bullish setup despite its recent 12% pullback from record highs. Analysts argue that a technical “megaphone” pattern could put targets as high as $260,000 within reach this cycle.
Bitcoin’s Megaphone Pattern Suggests New Highs Ahead
A megaphone pattern, or broadening wedge, appears when prices form higher highs and lower lows, typically leading to explosive breakouts once the upper trendline is breached.
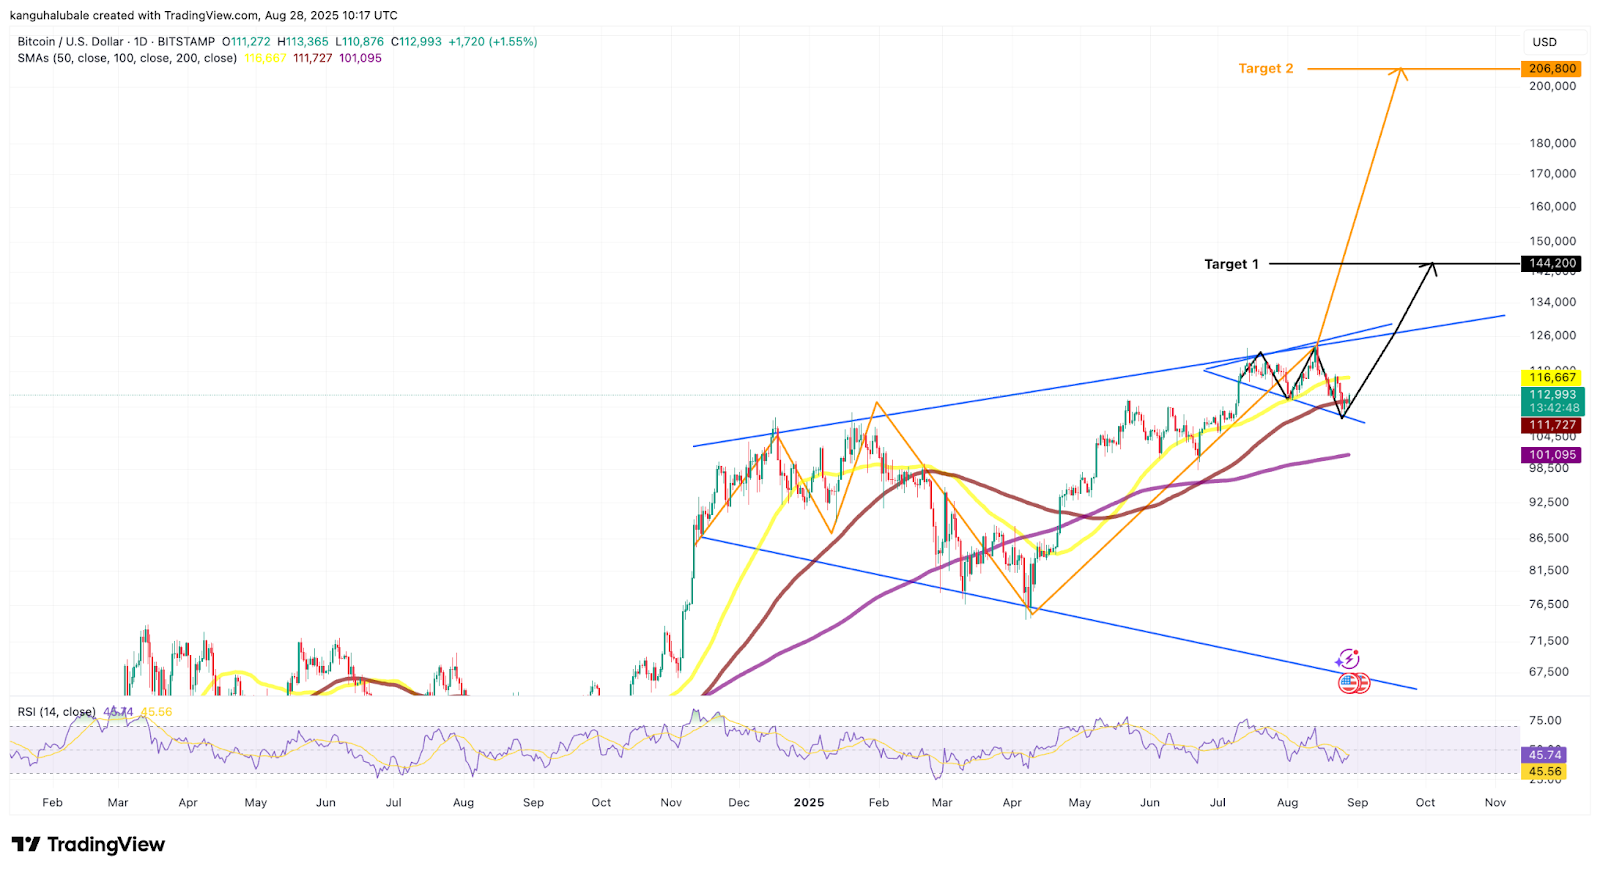
On Bitcoin’s daily chart, two such patterns are visible:
-
The first pattern, formed since July 11, shows Bitcoin rebounding from $108,000. A confirmed breakout above $124,900 — the recent all-time high from Aug. 14 — would open the door to a measured target of $144,200, representing a 27% gain.
-
The second, larger pattern, forming over the past 280 days, sets the stage for a potential surge to $206,800, which would mark an 82% gain from current levels.
Crypto influencer Faisal Baig has also pointed to an even broader megaphone on the weekly timeframe, with a potential target of $260,000.
“The next leg up is inevitable,” he noted.
Short-Term Holders Signal Panic
The recent drop to $108,000 rattled short-term holders (STHs) — investors who have held Bitcoin for less than 155 days. Many exited at a loss, pushing the STH Market Value to Realized Value (MVRV) ratio into oversold territory.
Analyst Frank Fetter observed that Bitcoin tapped the oversold zone on the MVRV Bollinger Bands, a condition last seen in April when Bitcoin bottomed at $74,000. From that point, the price staged a 51% recovery.

This suggests the current dip may mirror earlier shakeouts, potentially laying the groundwork for another strong rebound.
Institutional and Retail Buying Back In
Data shows accumulation by retail and institutional investors is now at its highest since April’s dip below $75,000. With buyers stepping in aggressively, many see the $108,000 level as a local bottom, strengthening the case for Bitcoin’s next upward push.
Outlook
Bitcoin’s megaphone pattern, combined with oversold short-term holder metrics, paints a bullish picture despite recent volatility. If historical behavior repeats, the cryptocurrency may be preparing for a run that could push it toward $260,000 in this cycle.
Share This


